We know that you are looking for a solution that will allow you to: reduce liability, reduce costs, protect people and assets, and protect your organization’s brand.
All while using a technology that will be: objective, actionable, repeatable, and scalable.
Realistically, who can really use 10, 50, or hundreds of narrative reports to communicate or analyze the complex aspects of risk management to make proper decisions? Truly technology and a database/analytical approach is necessary to aggregate and analyze the tremendous amounts of data captured during the assessment process.
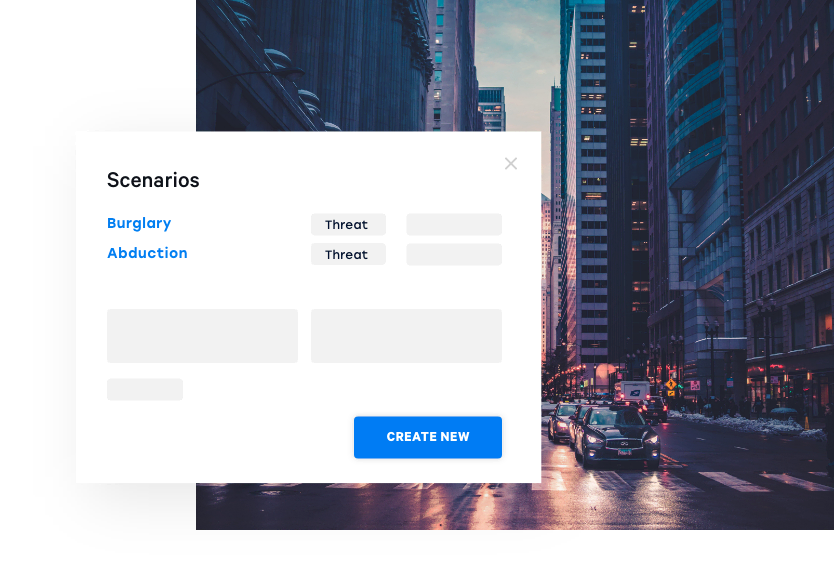
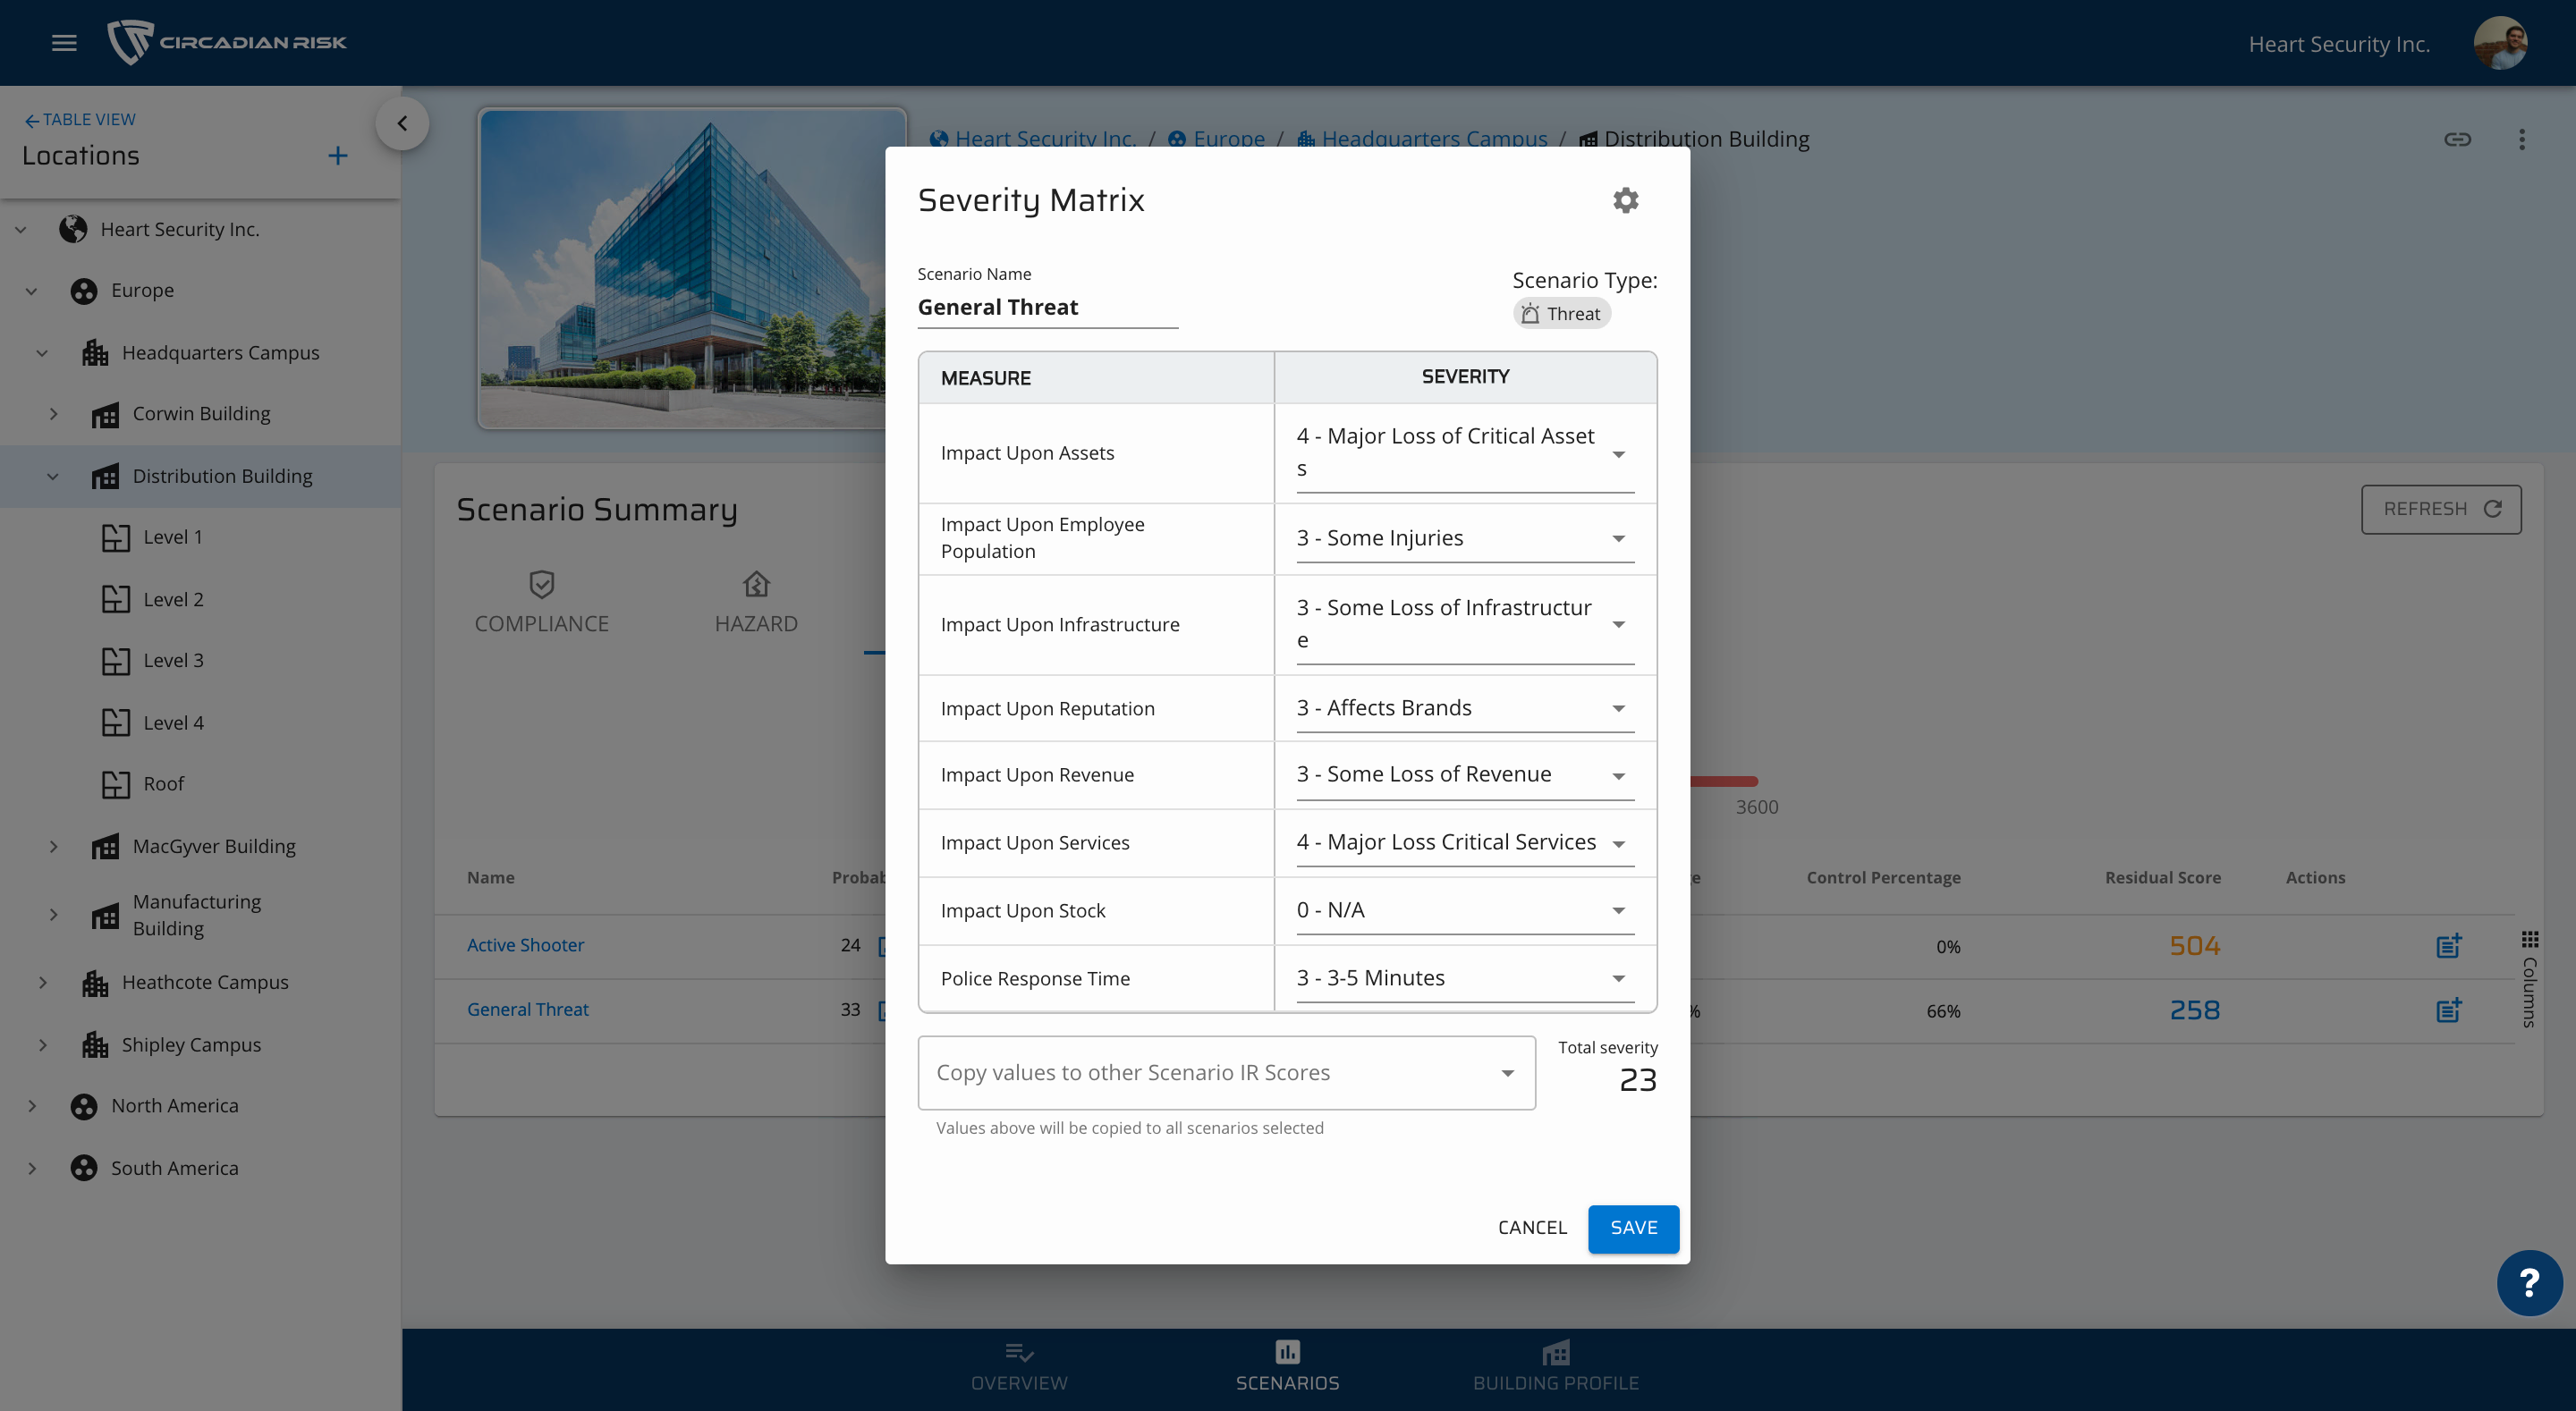 Dynamic Threat and Impact Assessments™
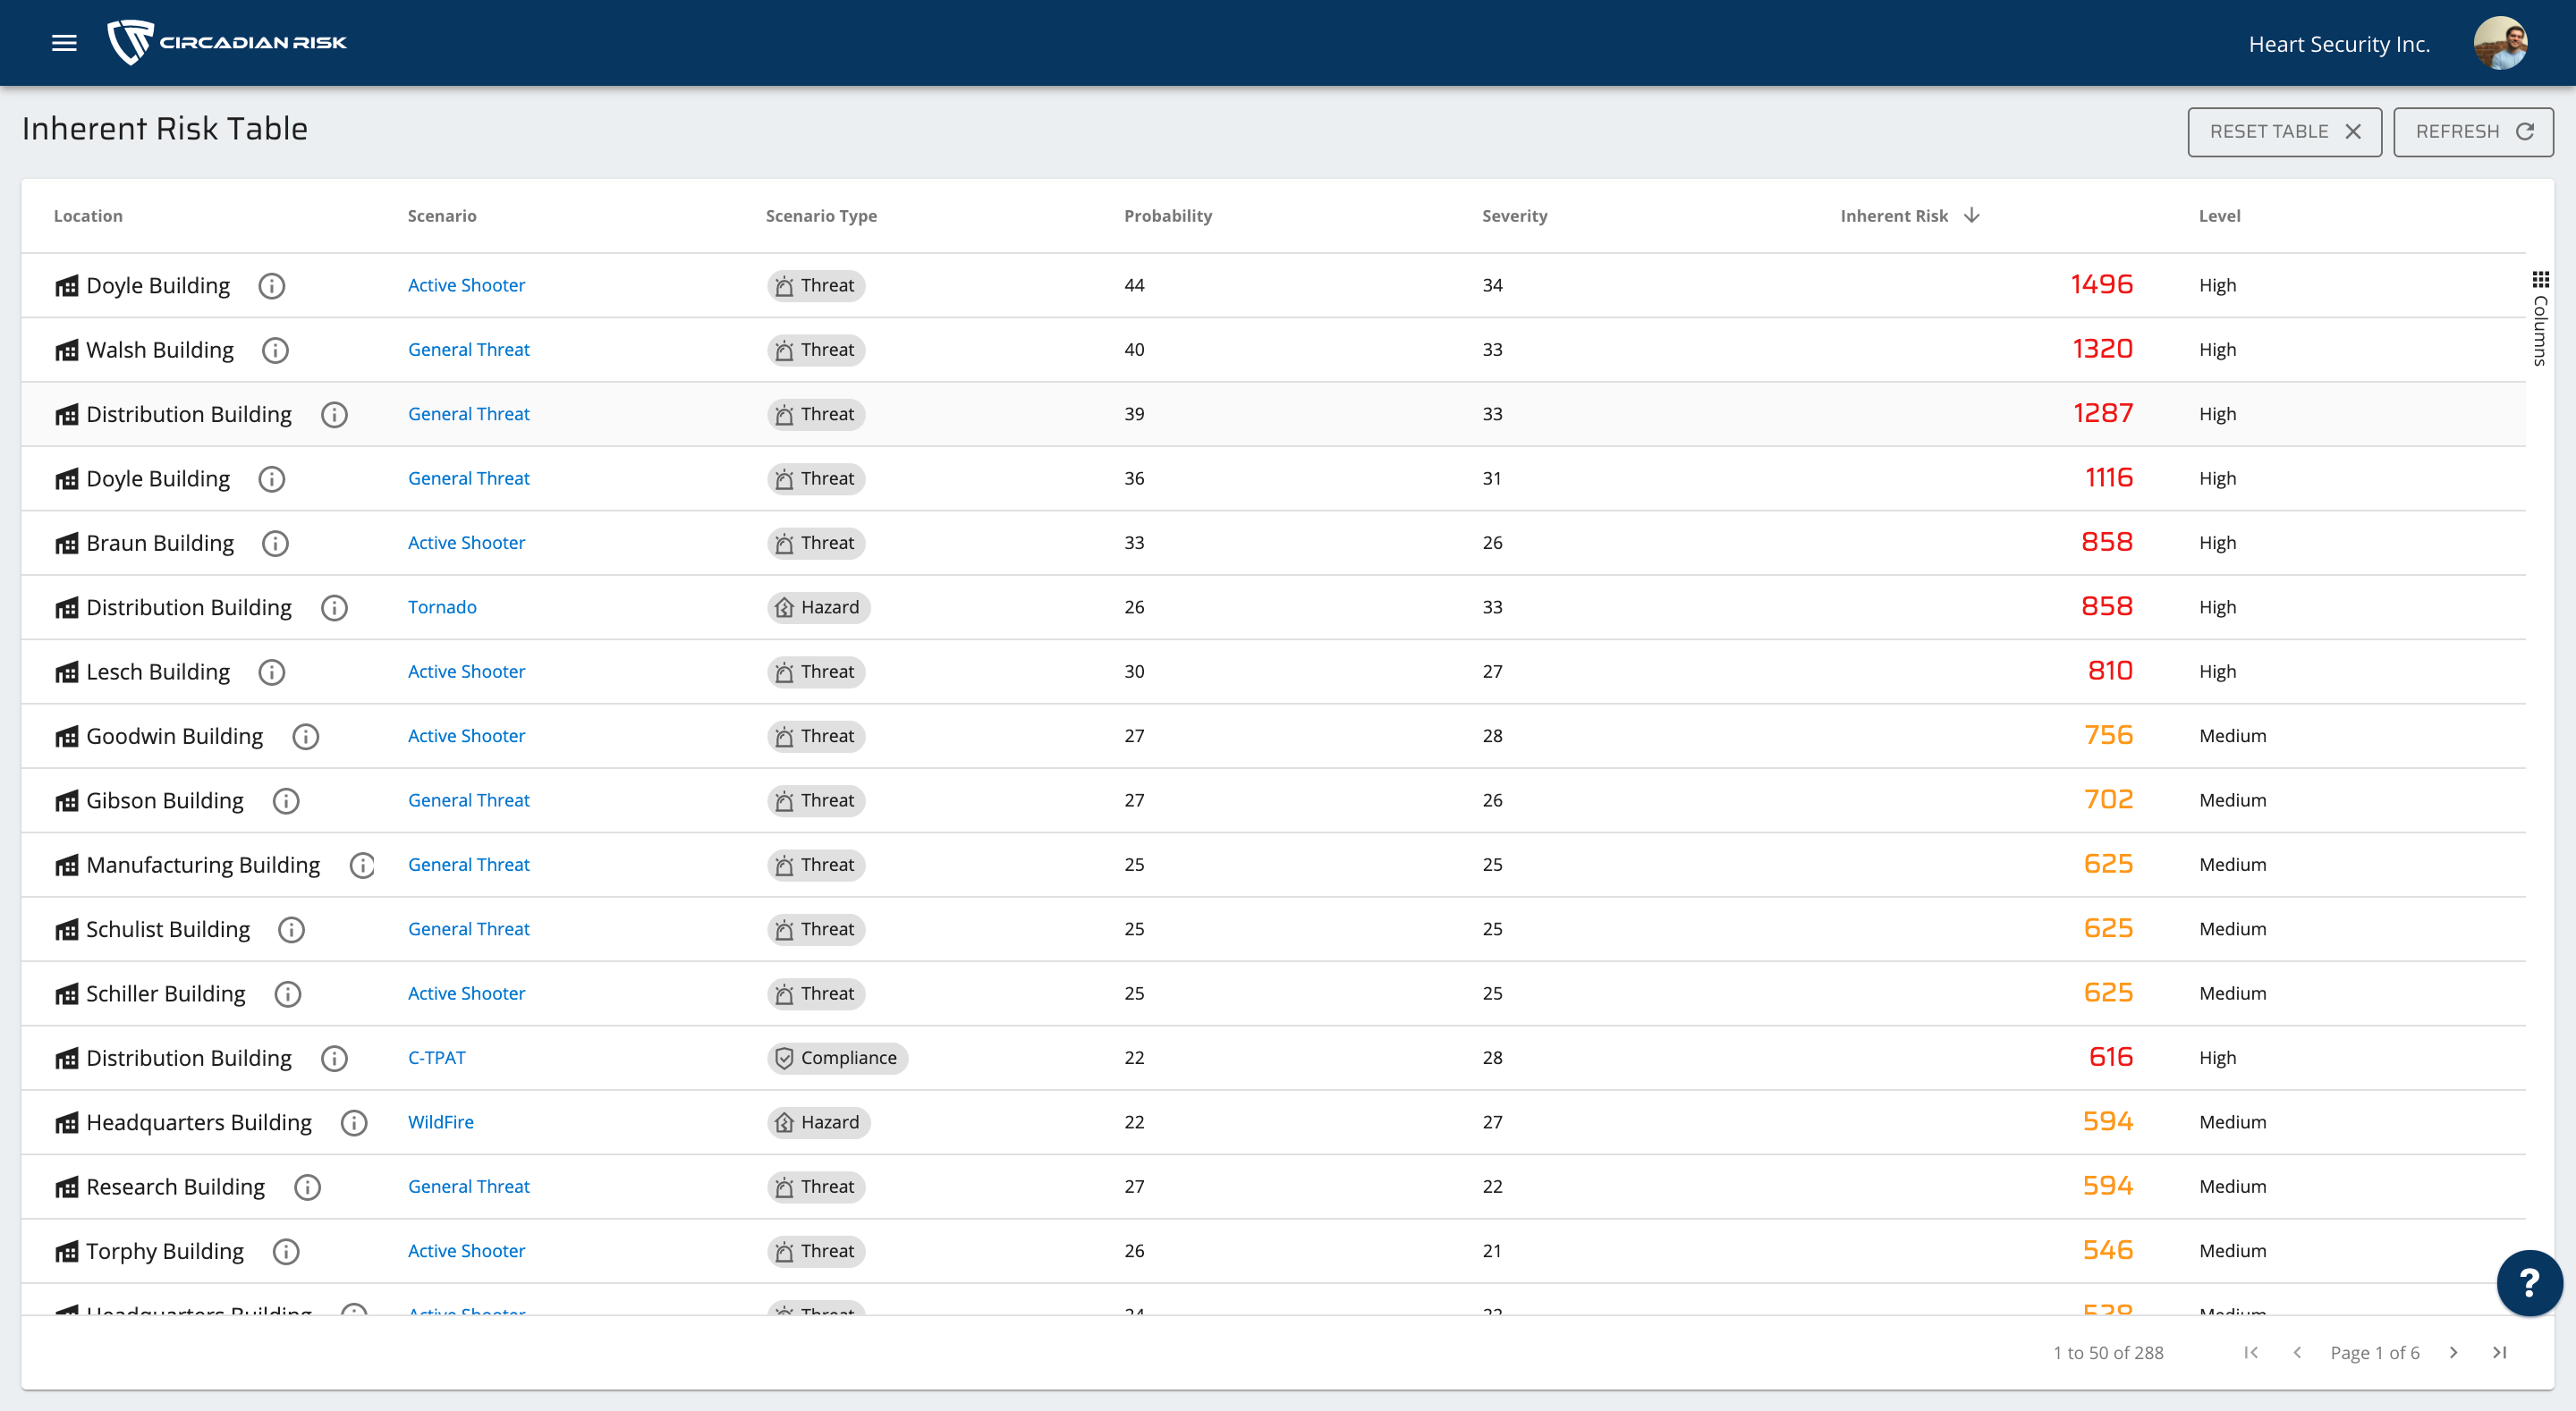 Ranking Dashboard and Prioritization
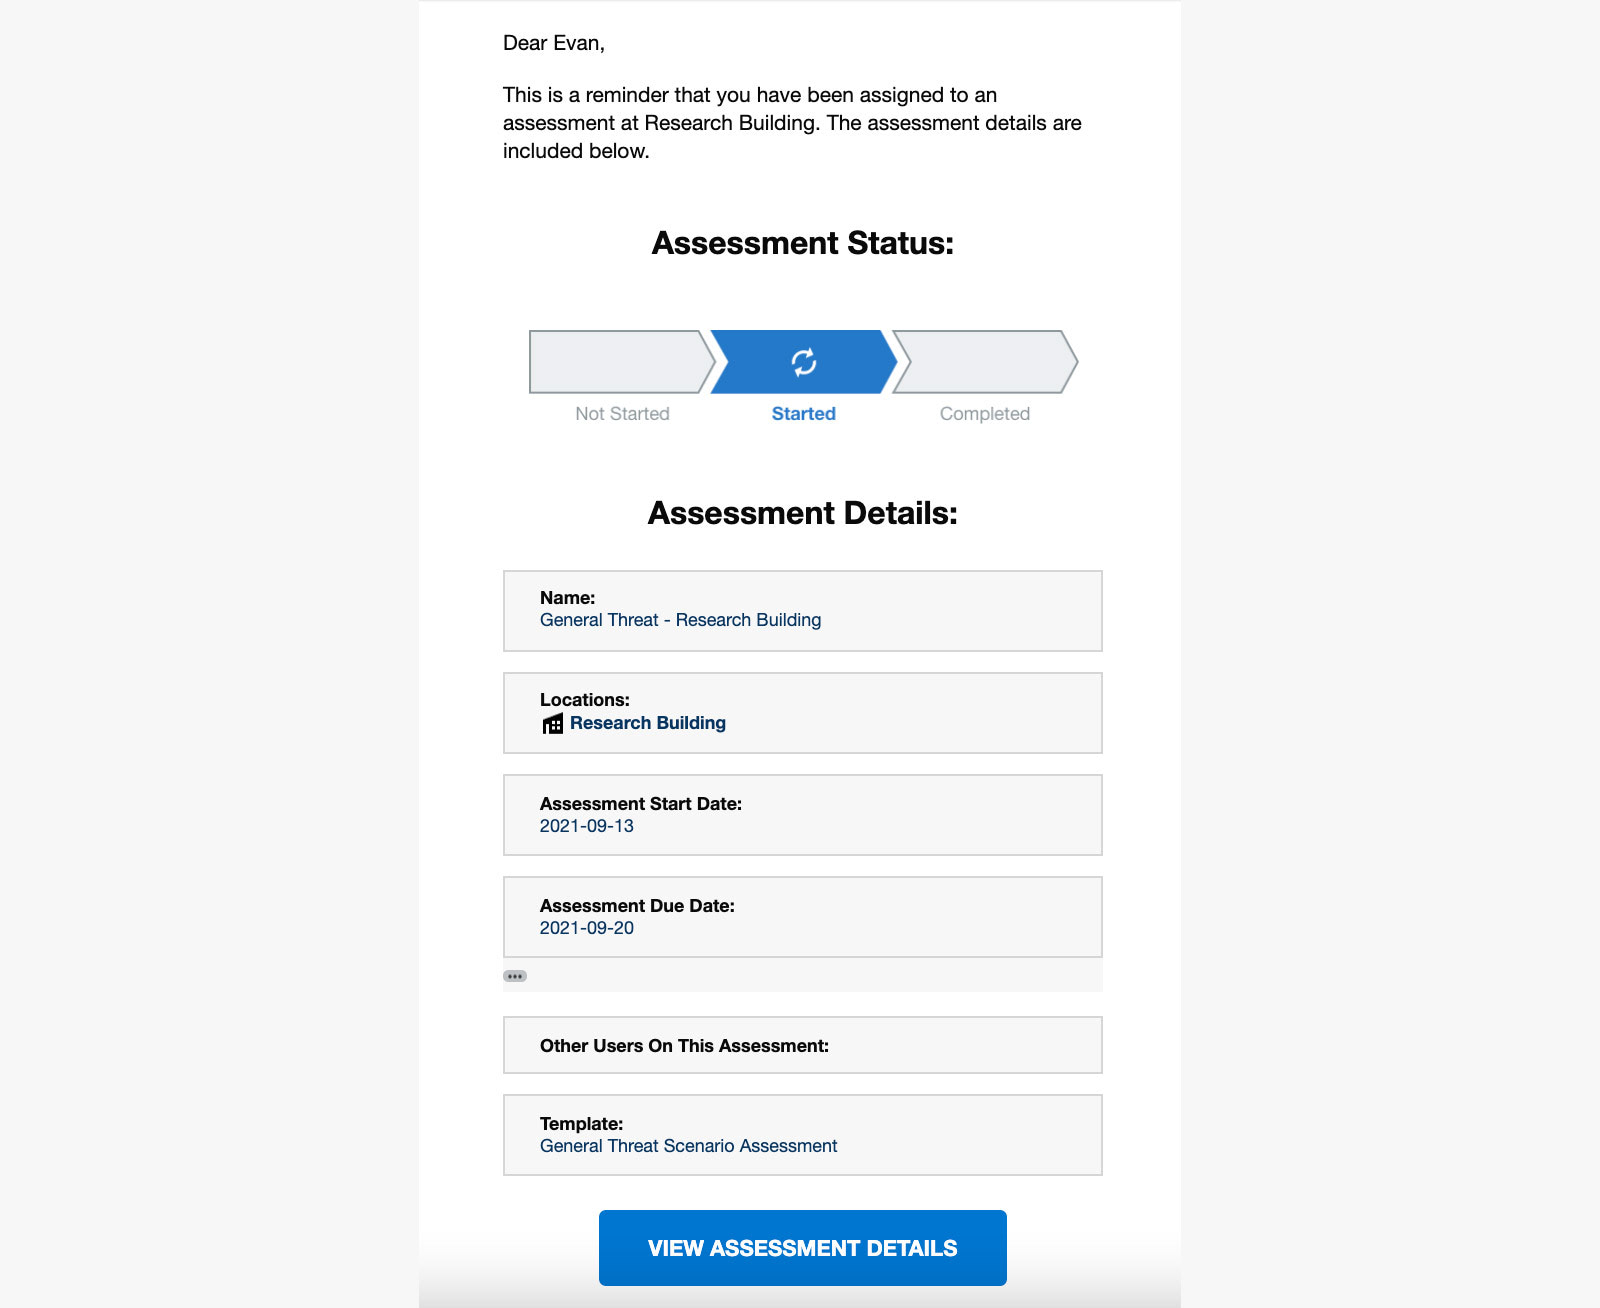 Assessment Due Dates and Reminders
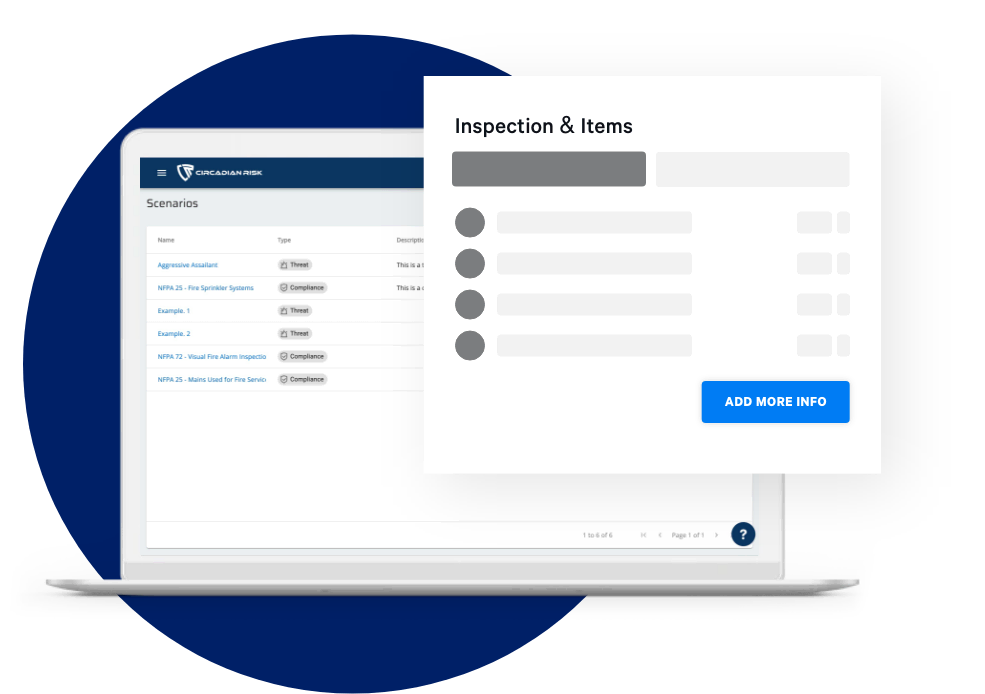
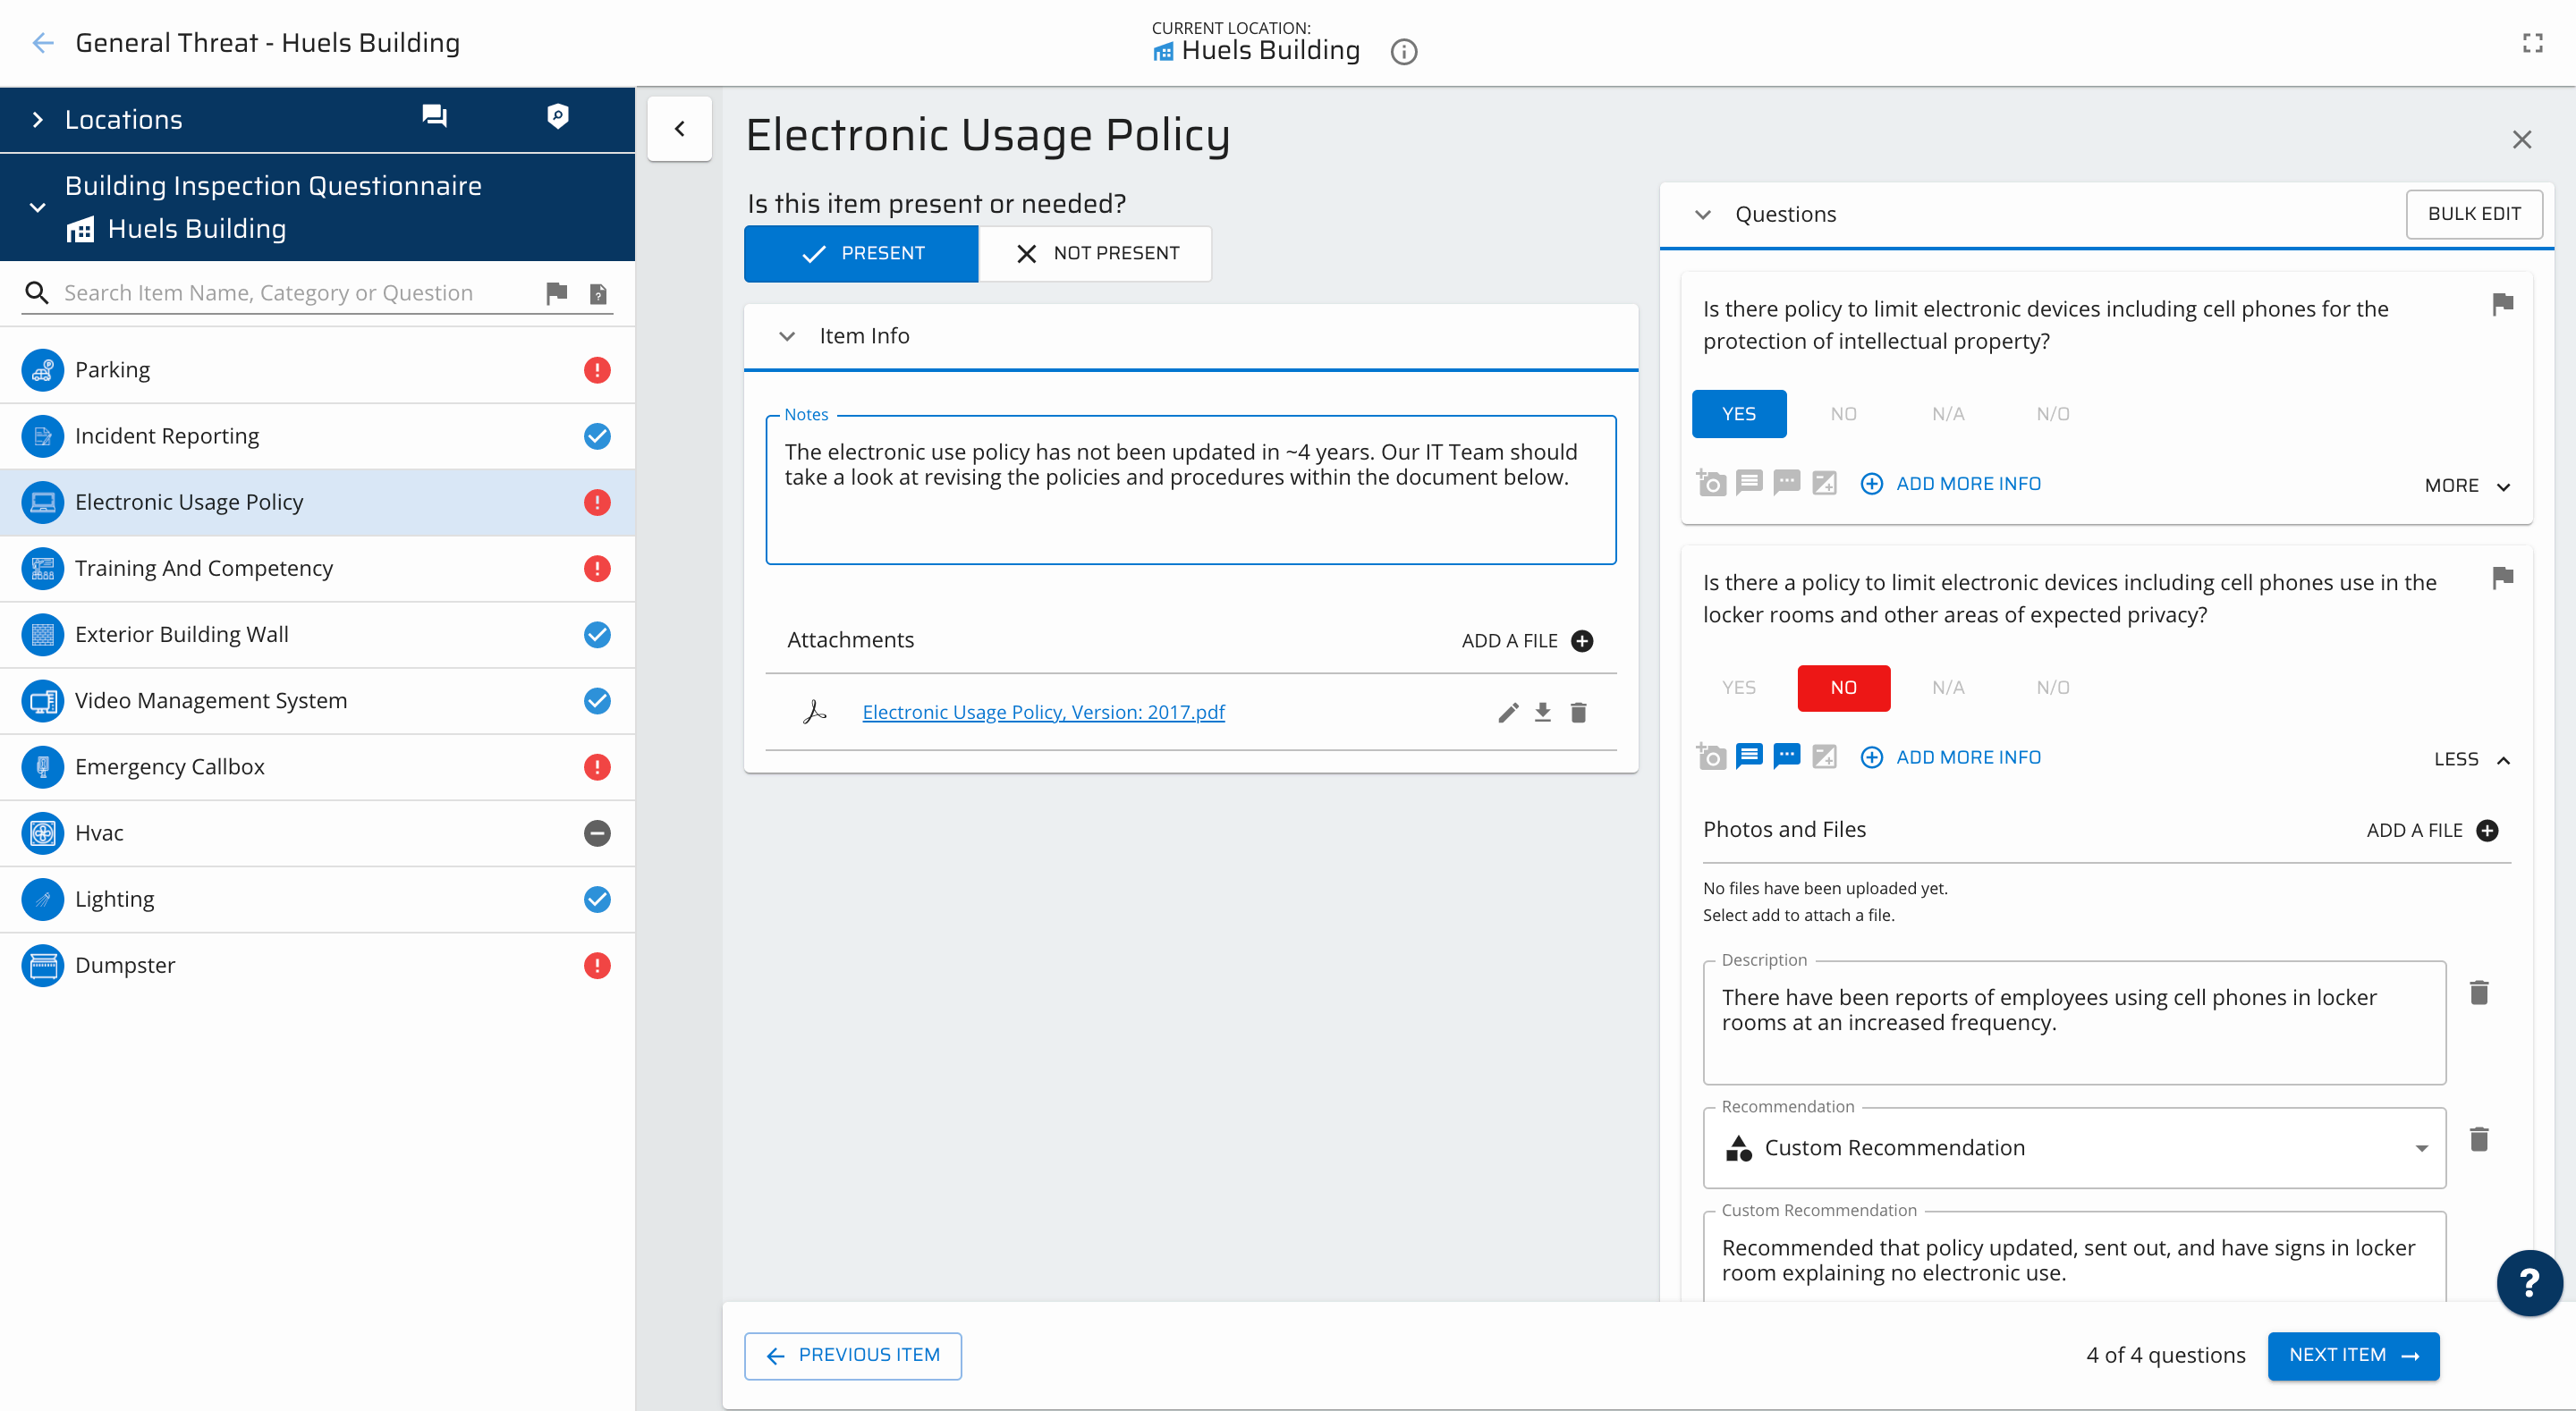 Inspection Questionnaire
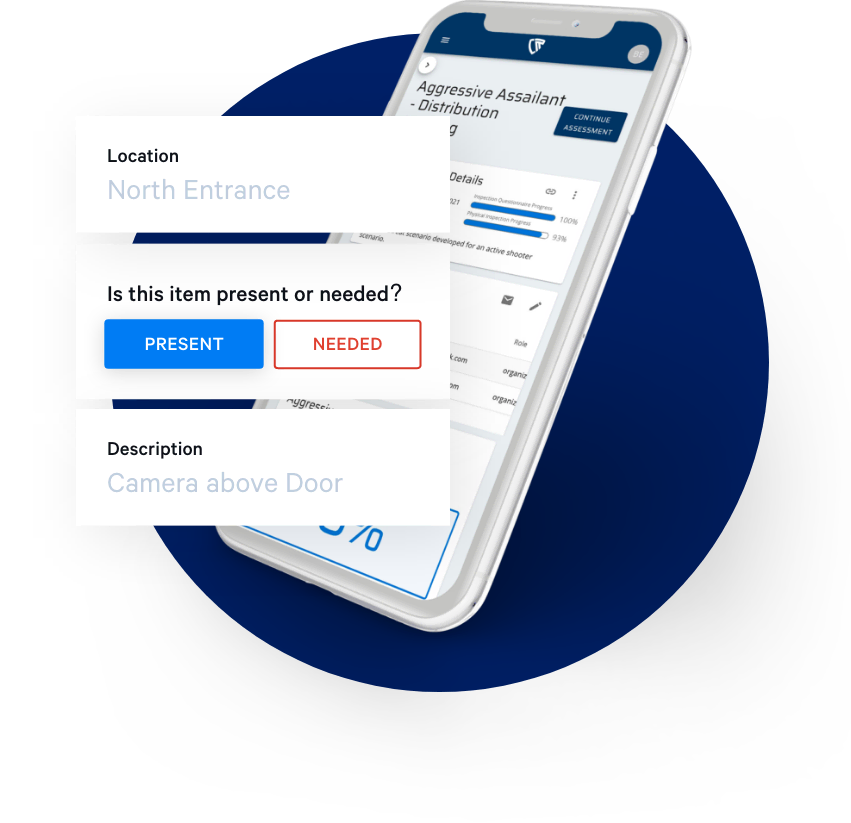
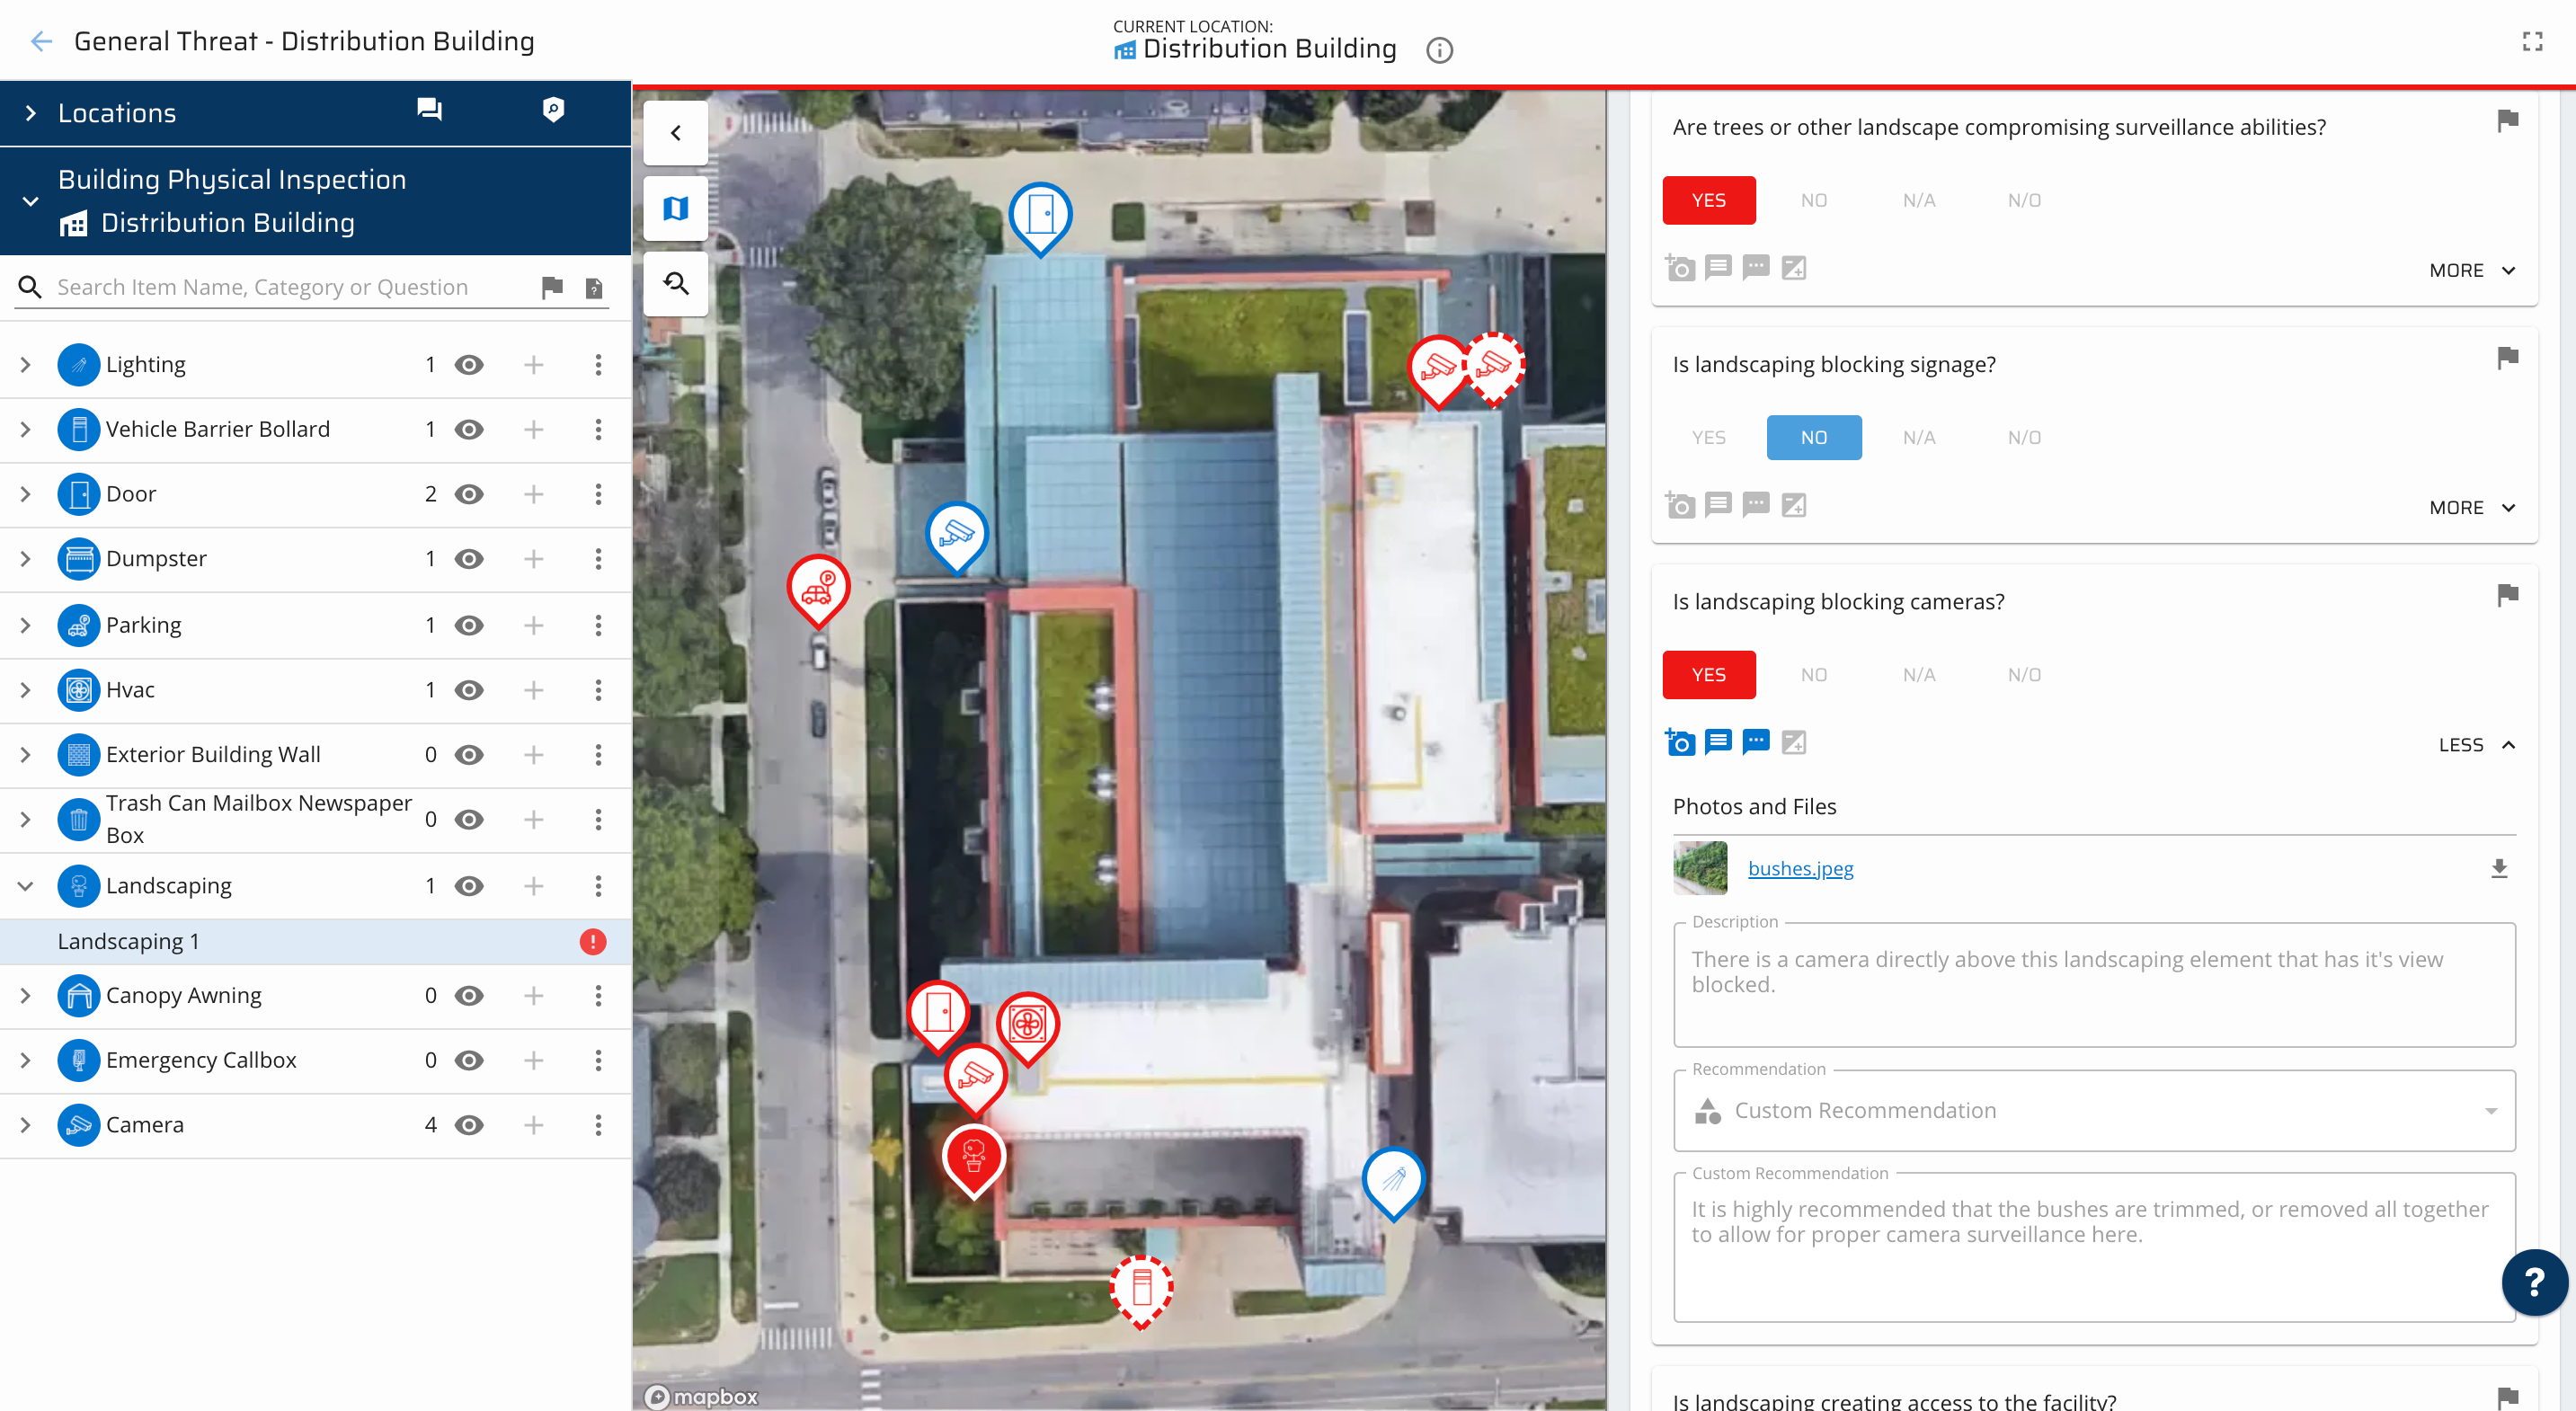 Physical Inspection Questionnaire
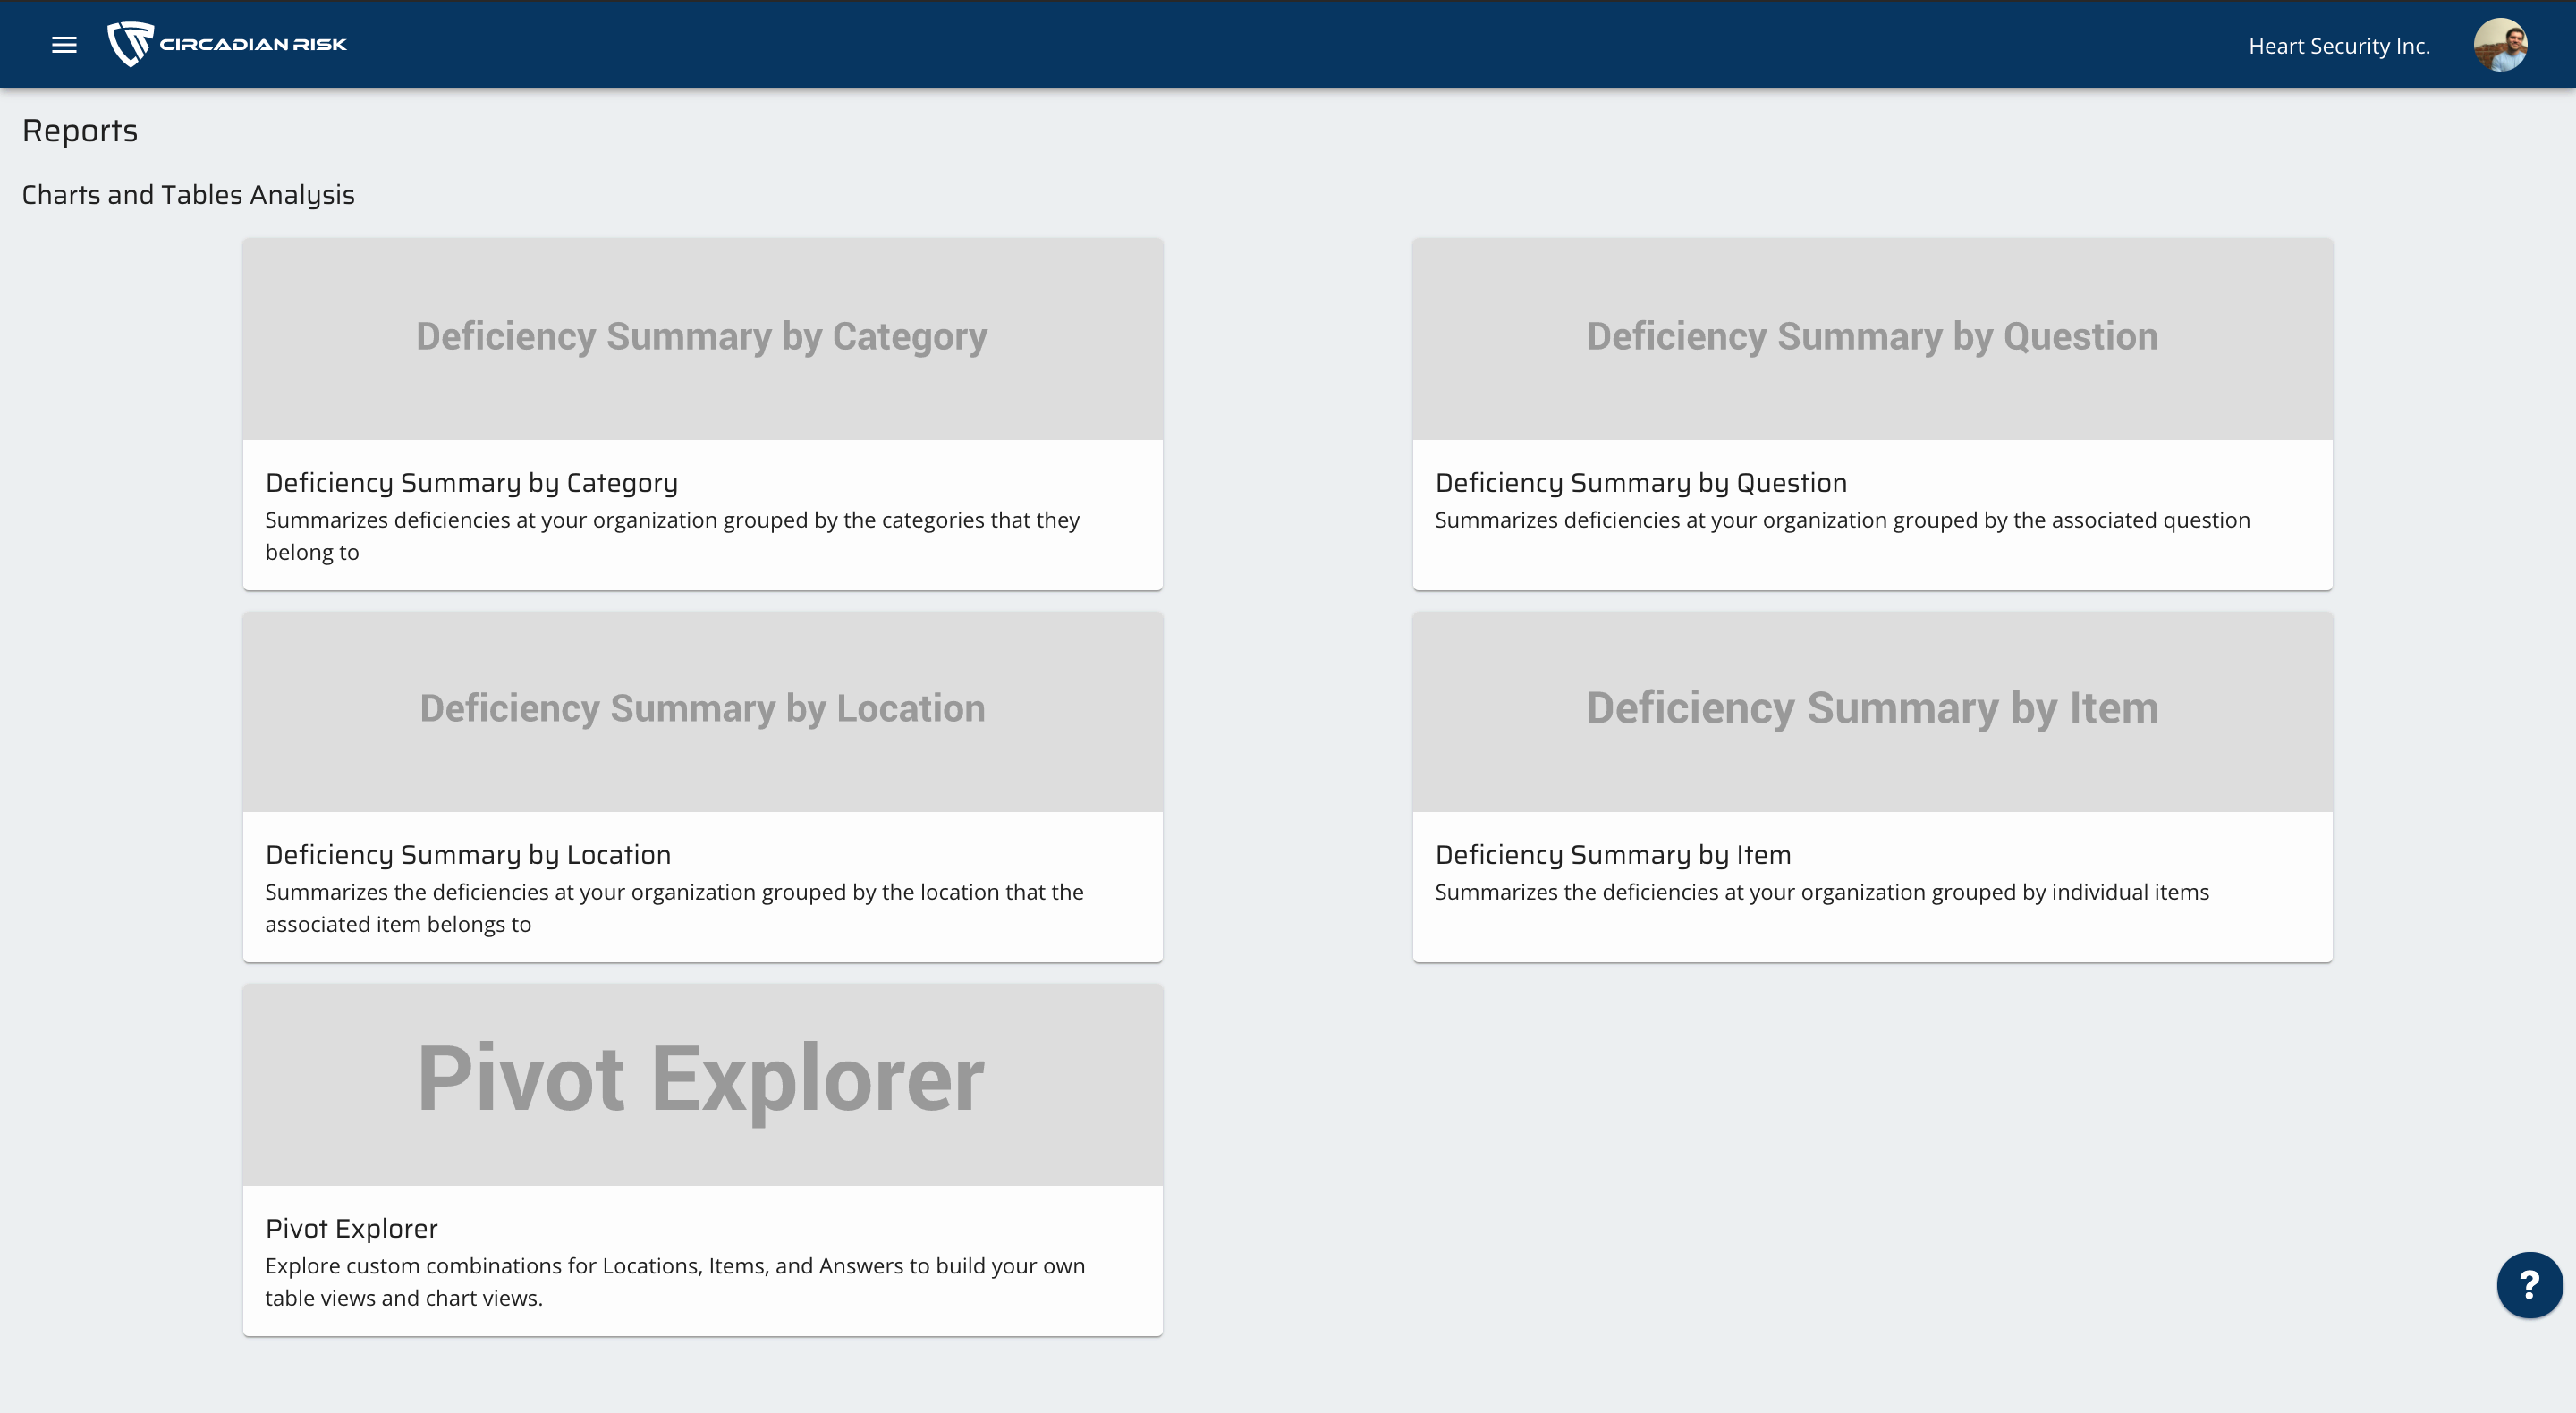
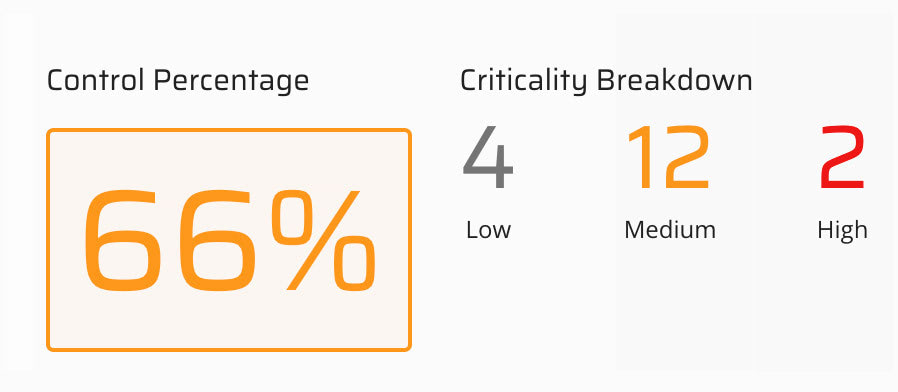
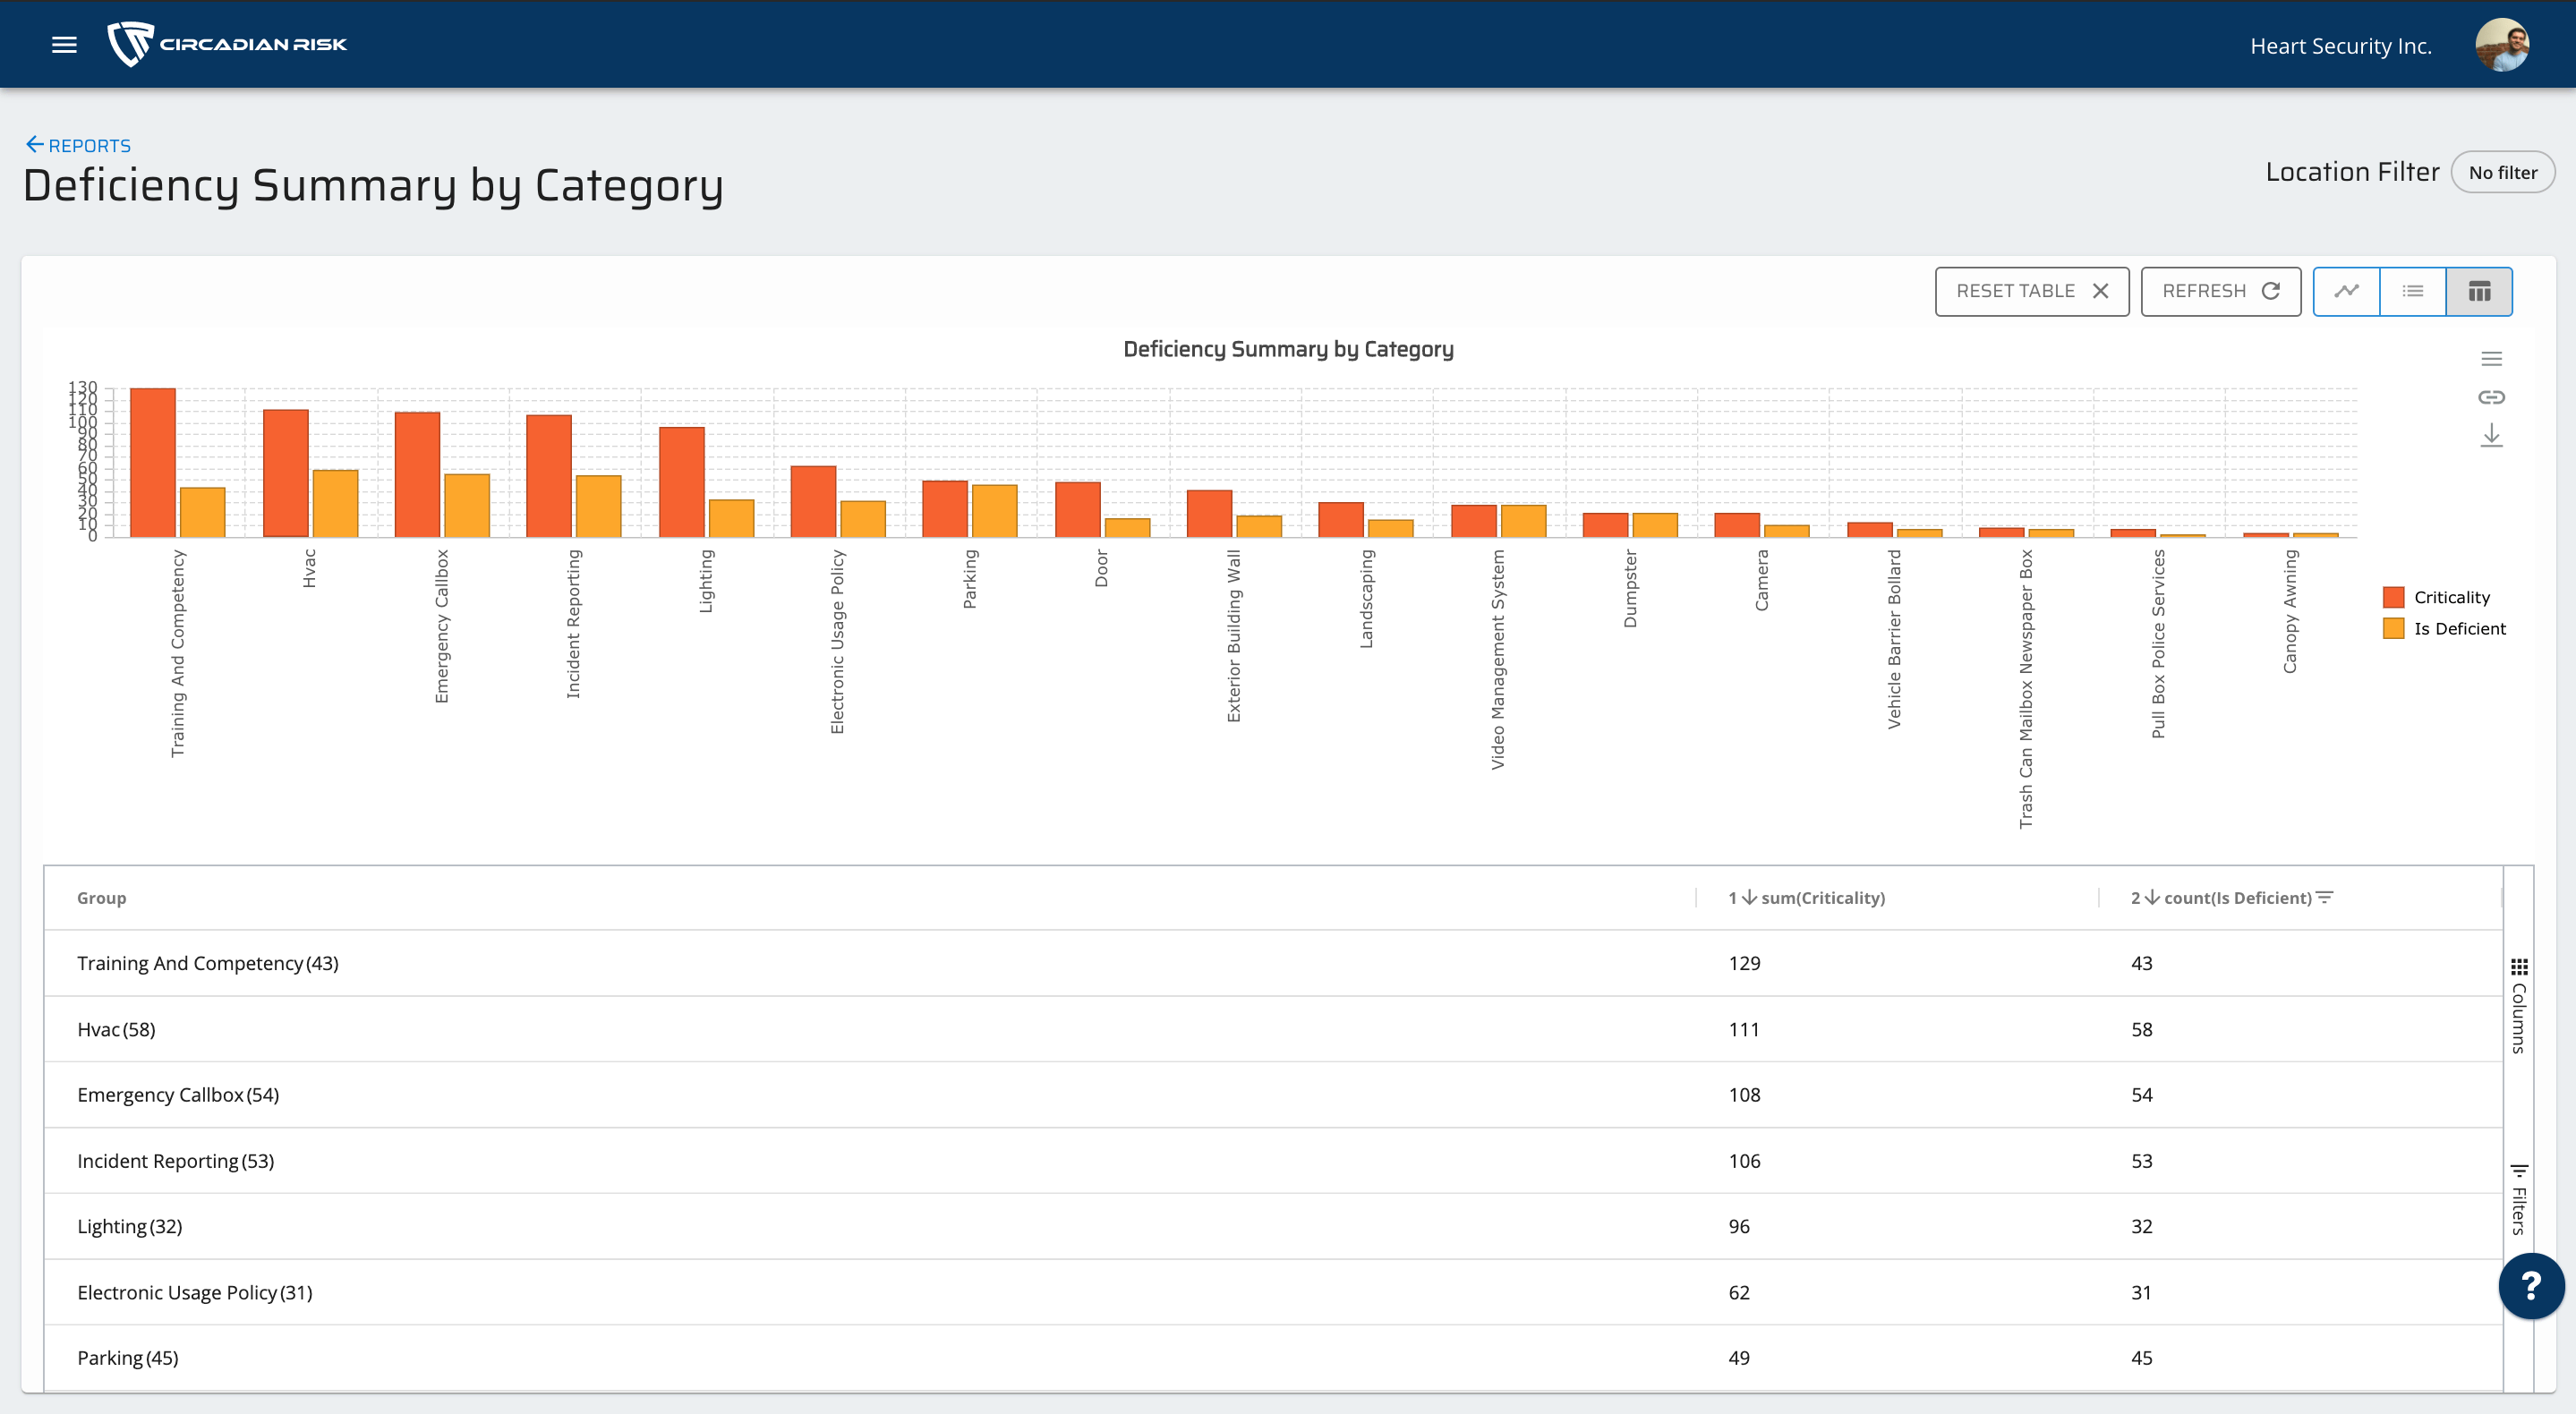 Customizable Aggregate Data, Reporting Charts, and Tables
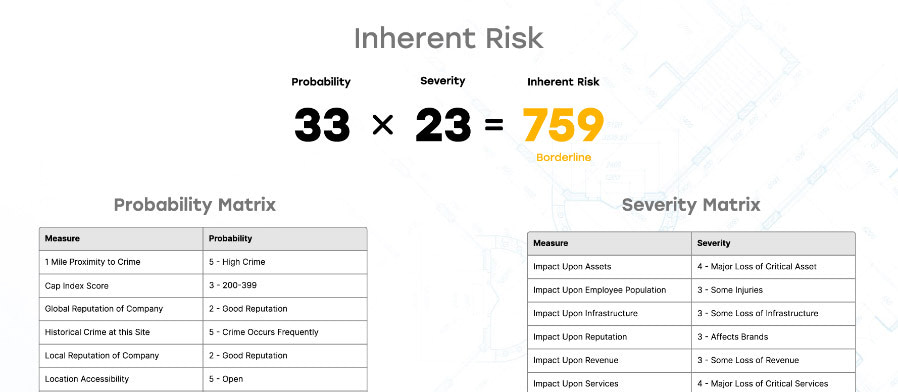
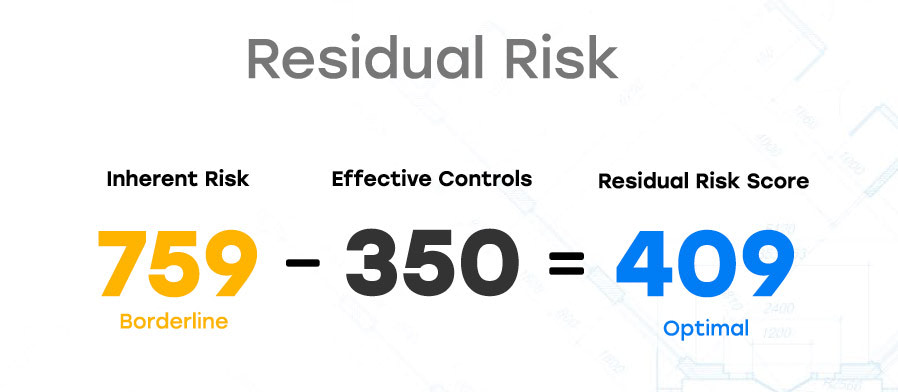
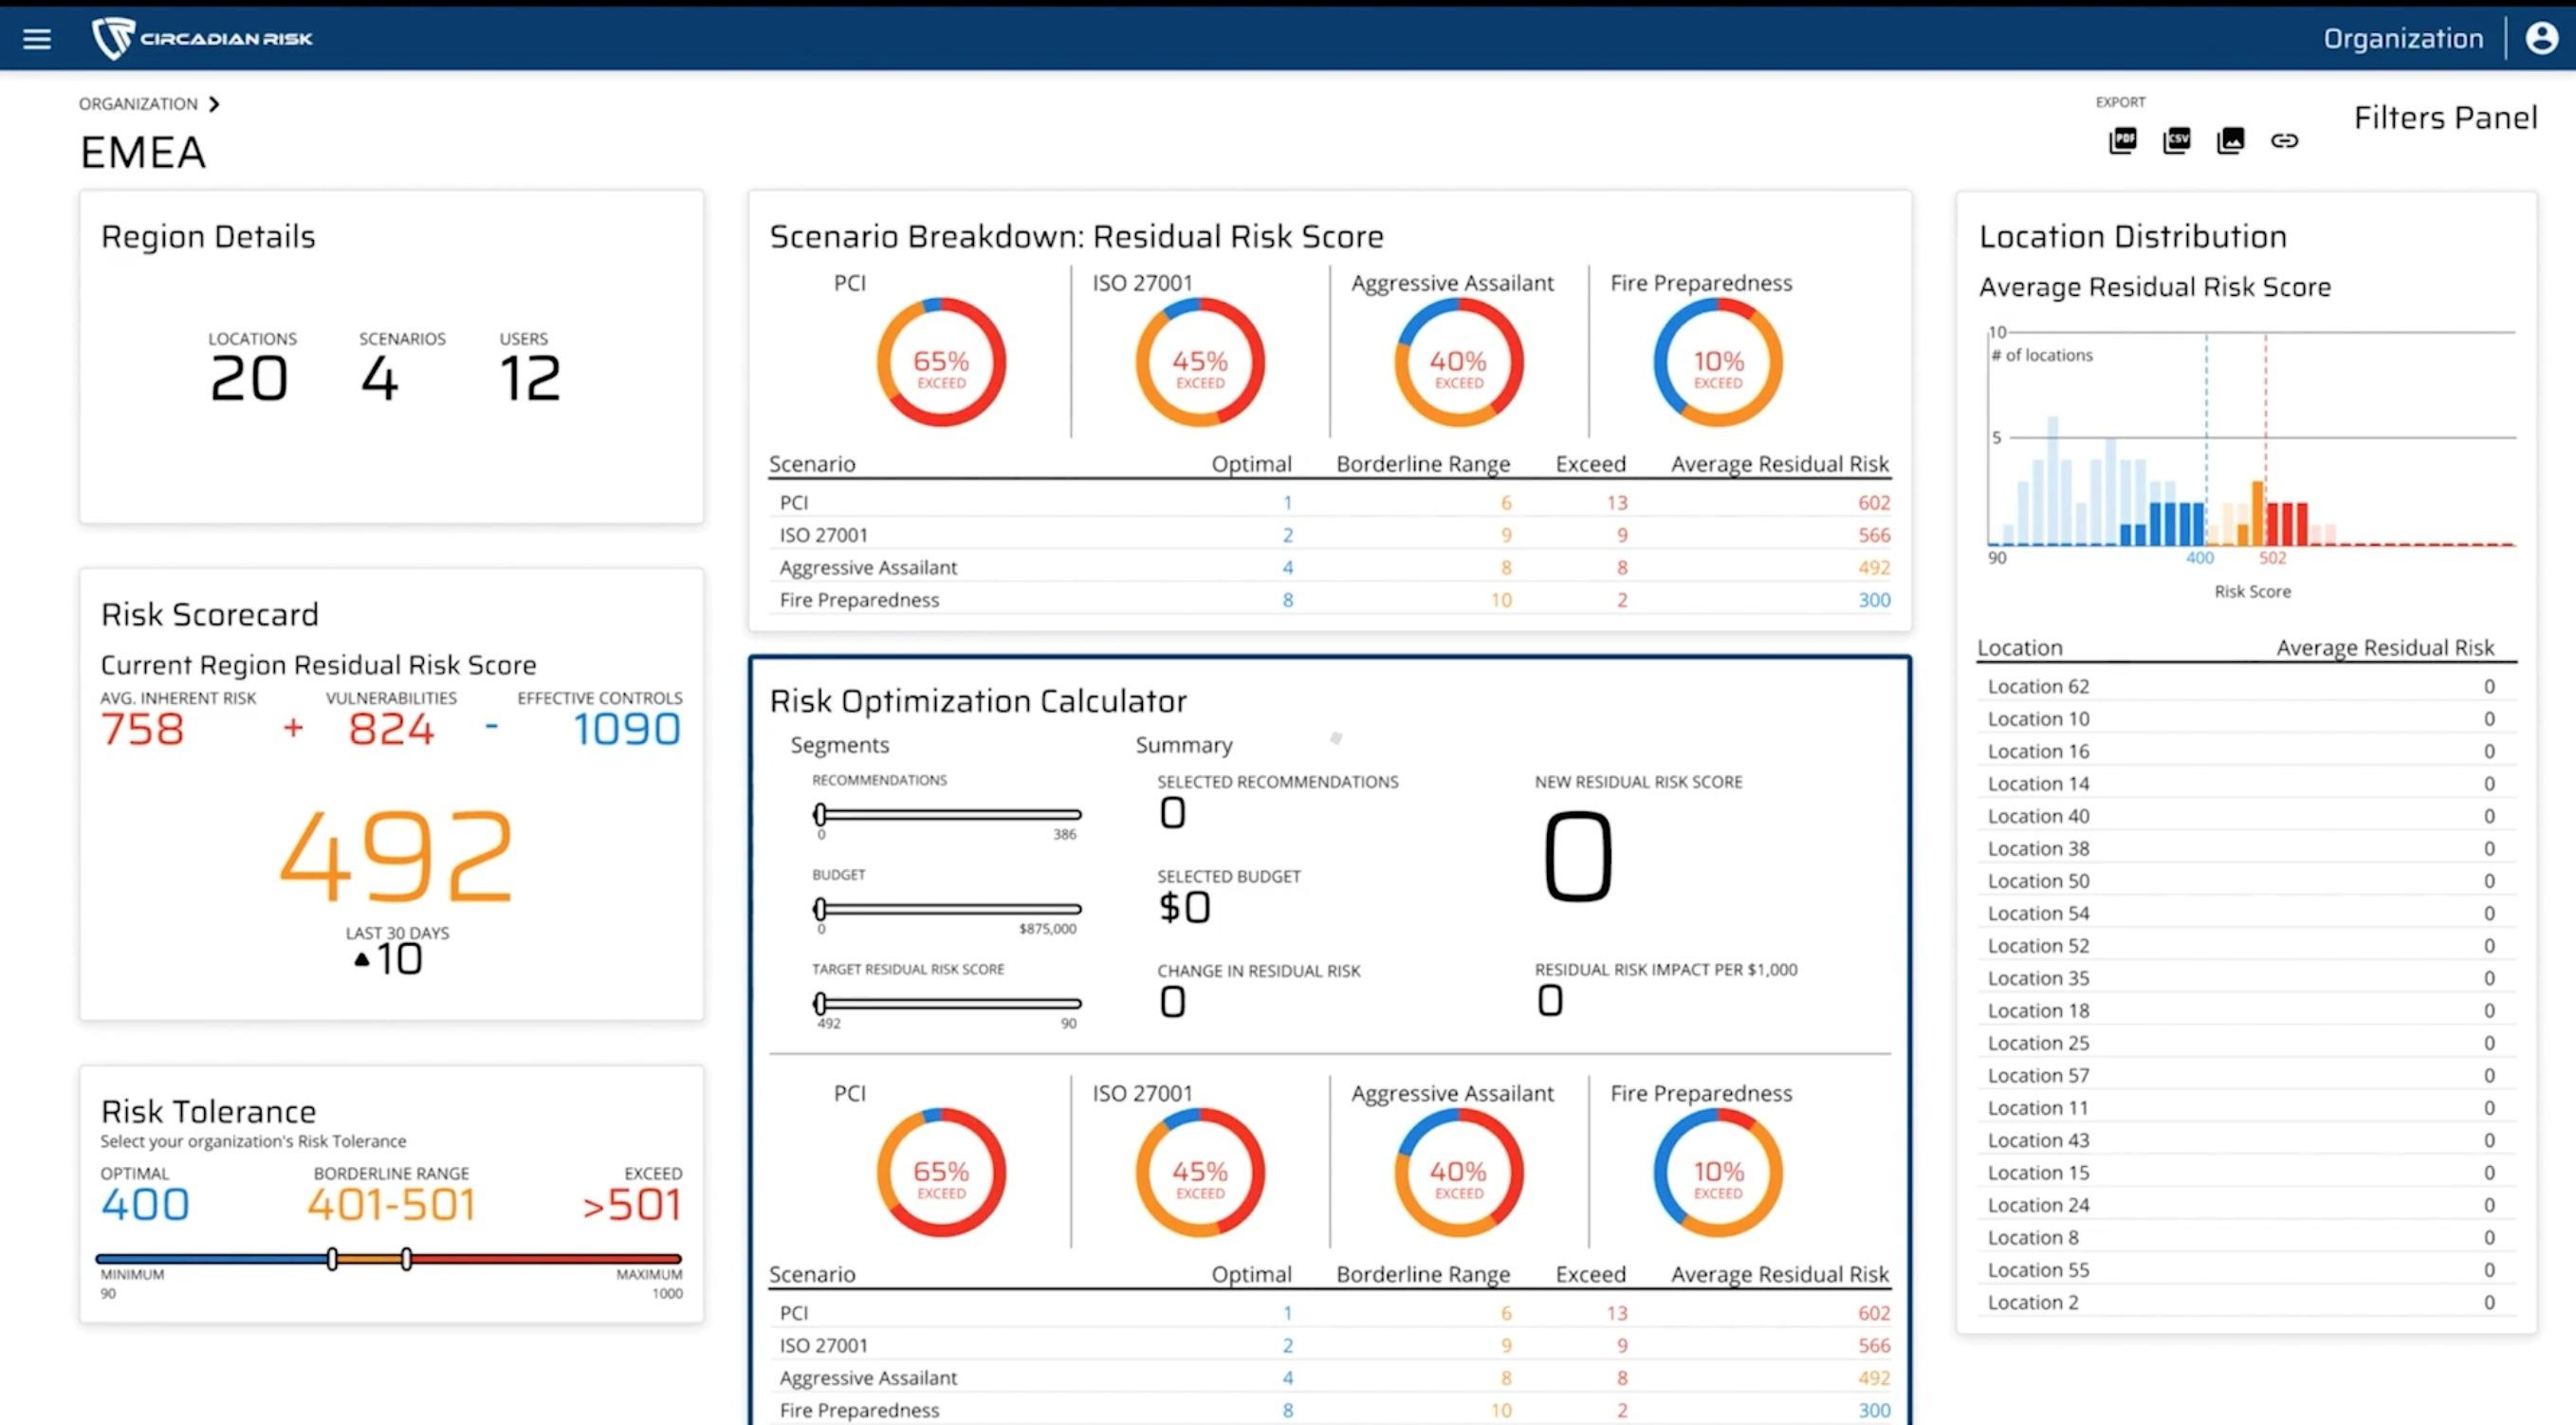 Risk Optimization Calculator
 Corrective Action Plans and Strategies™
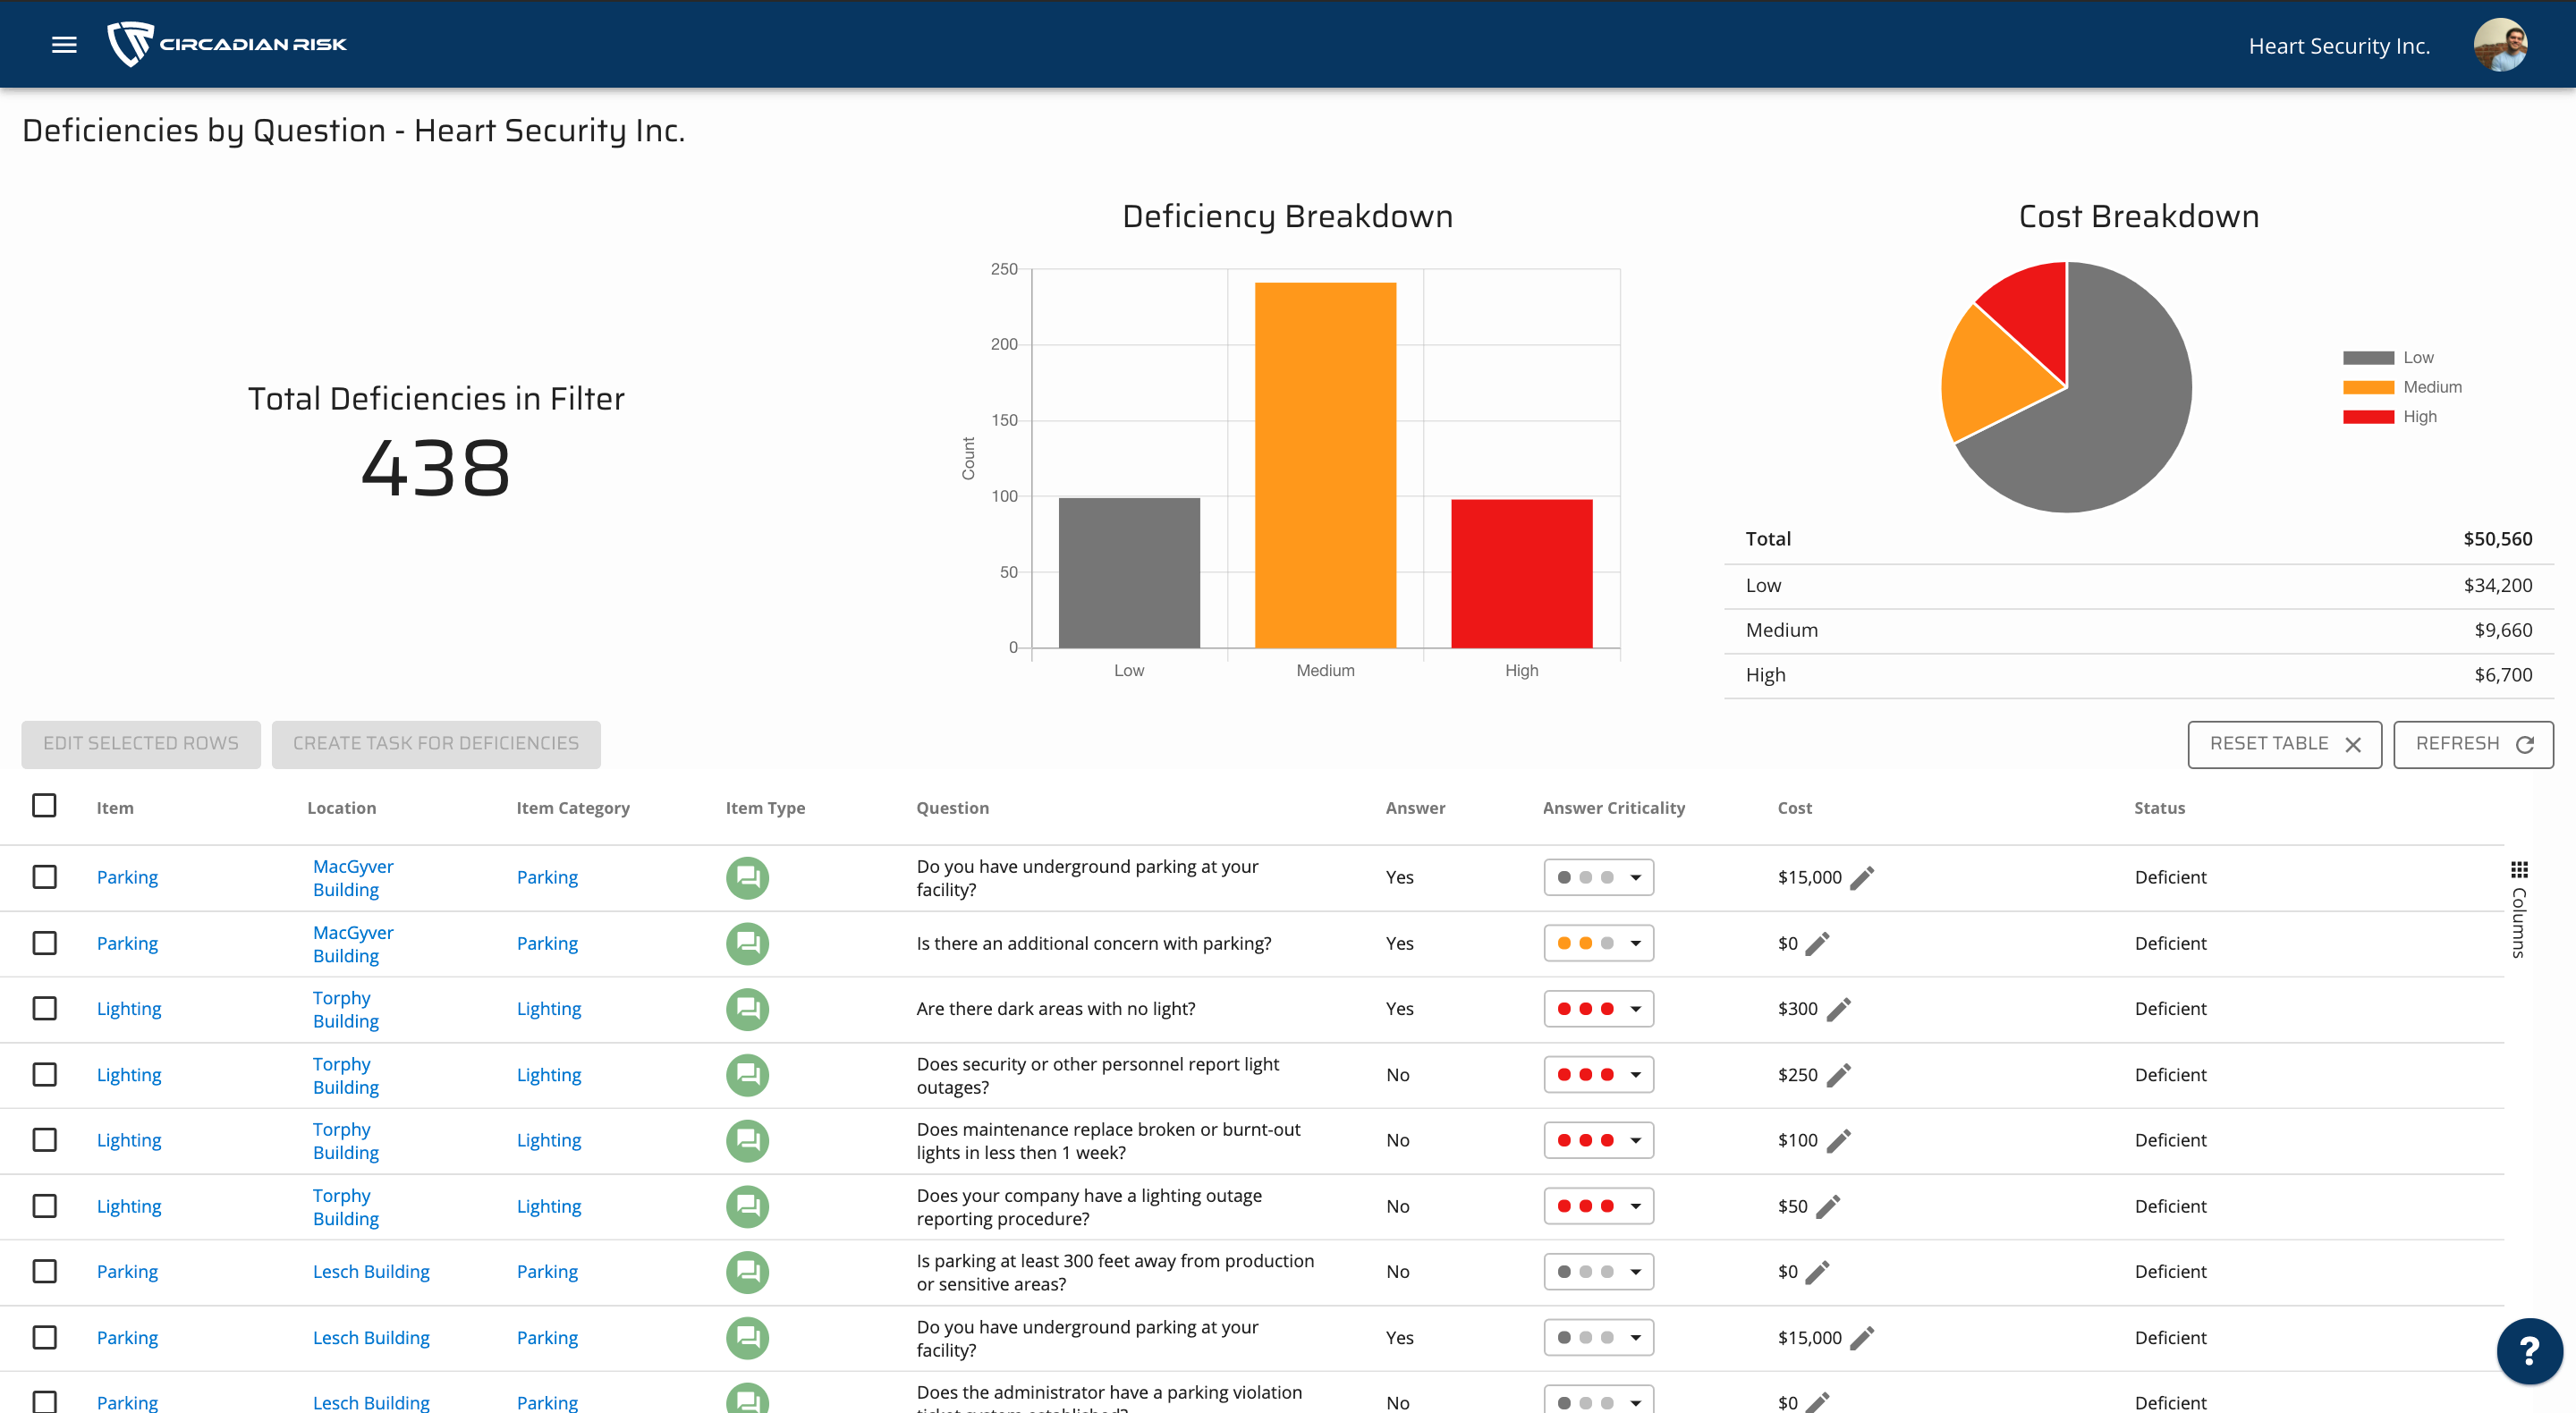
 Deficiency Dashboard
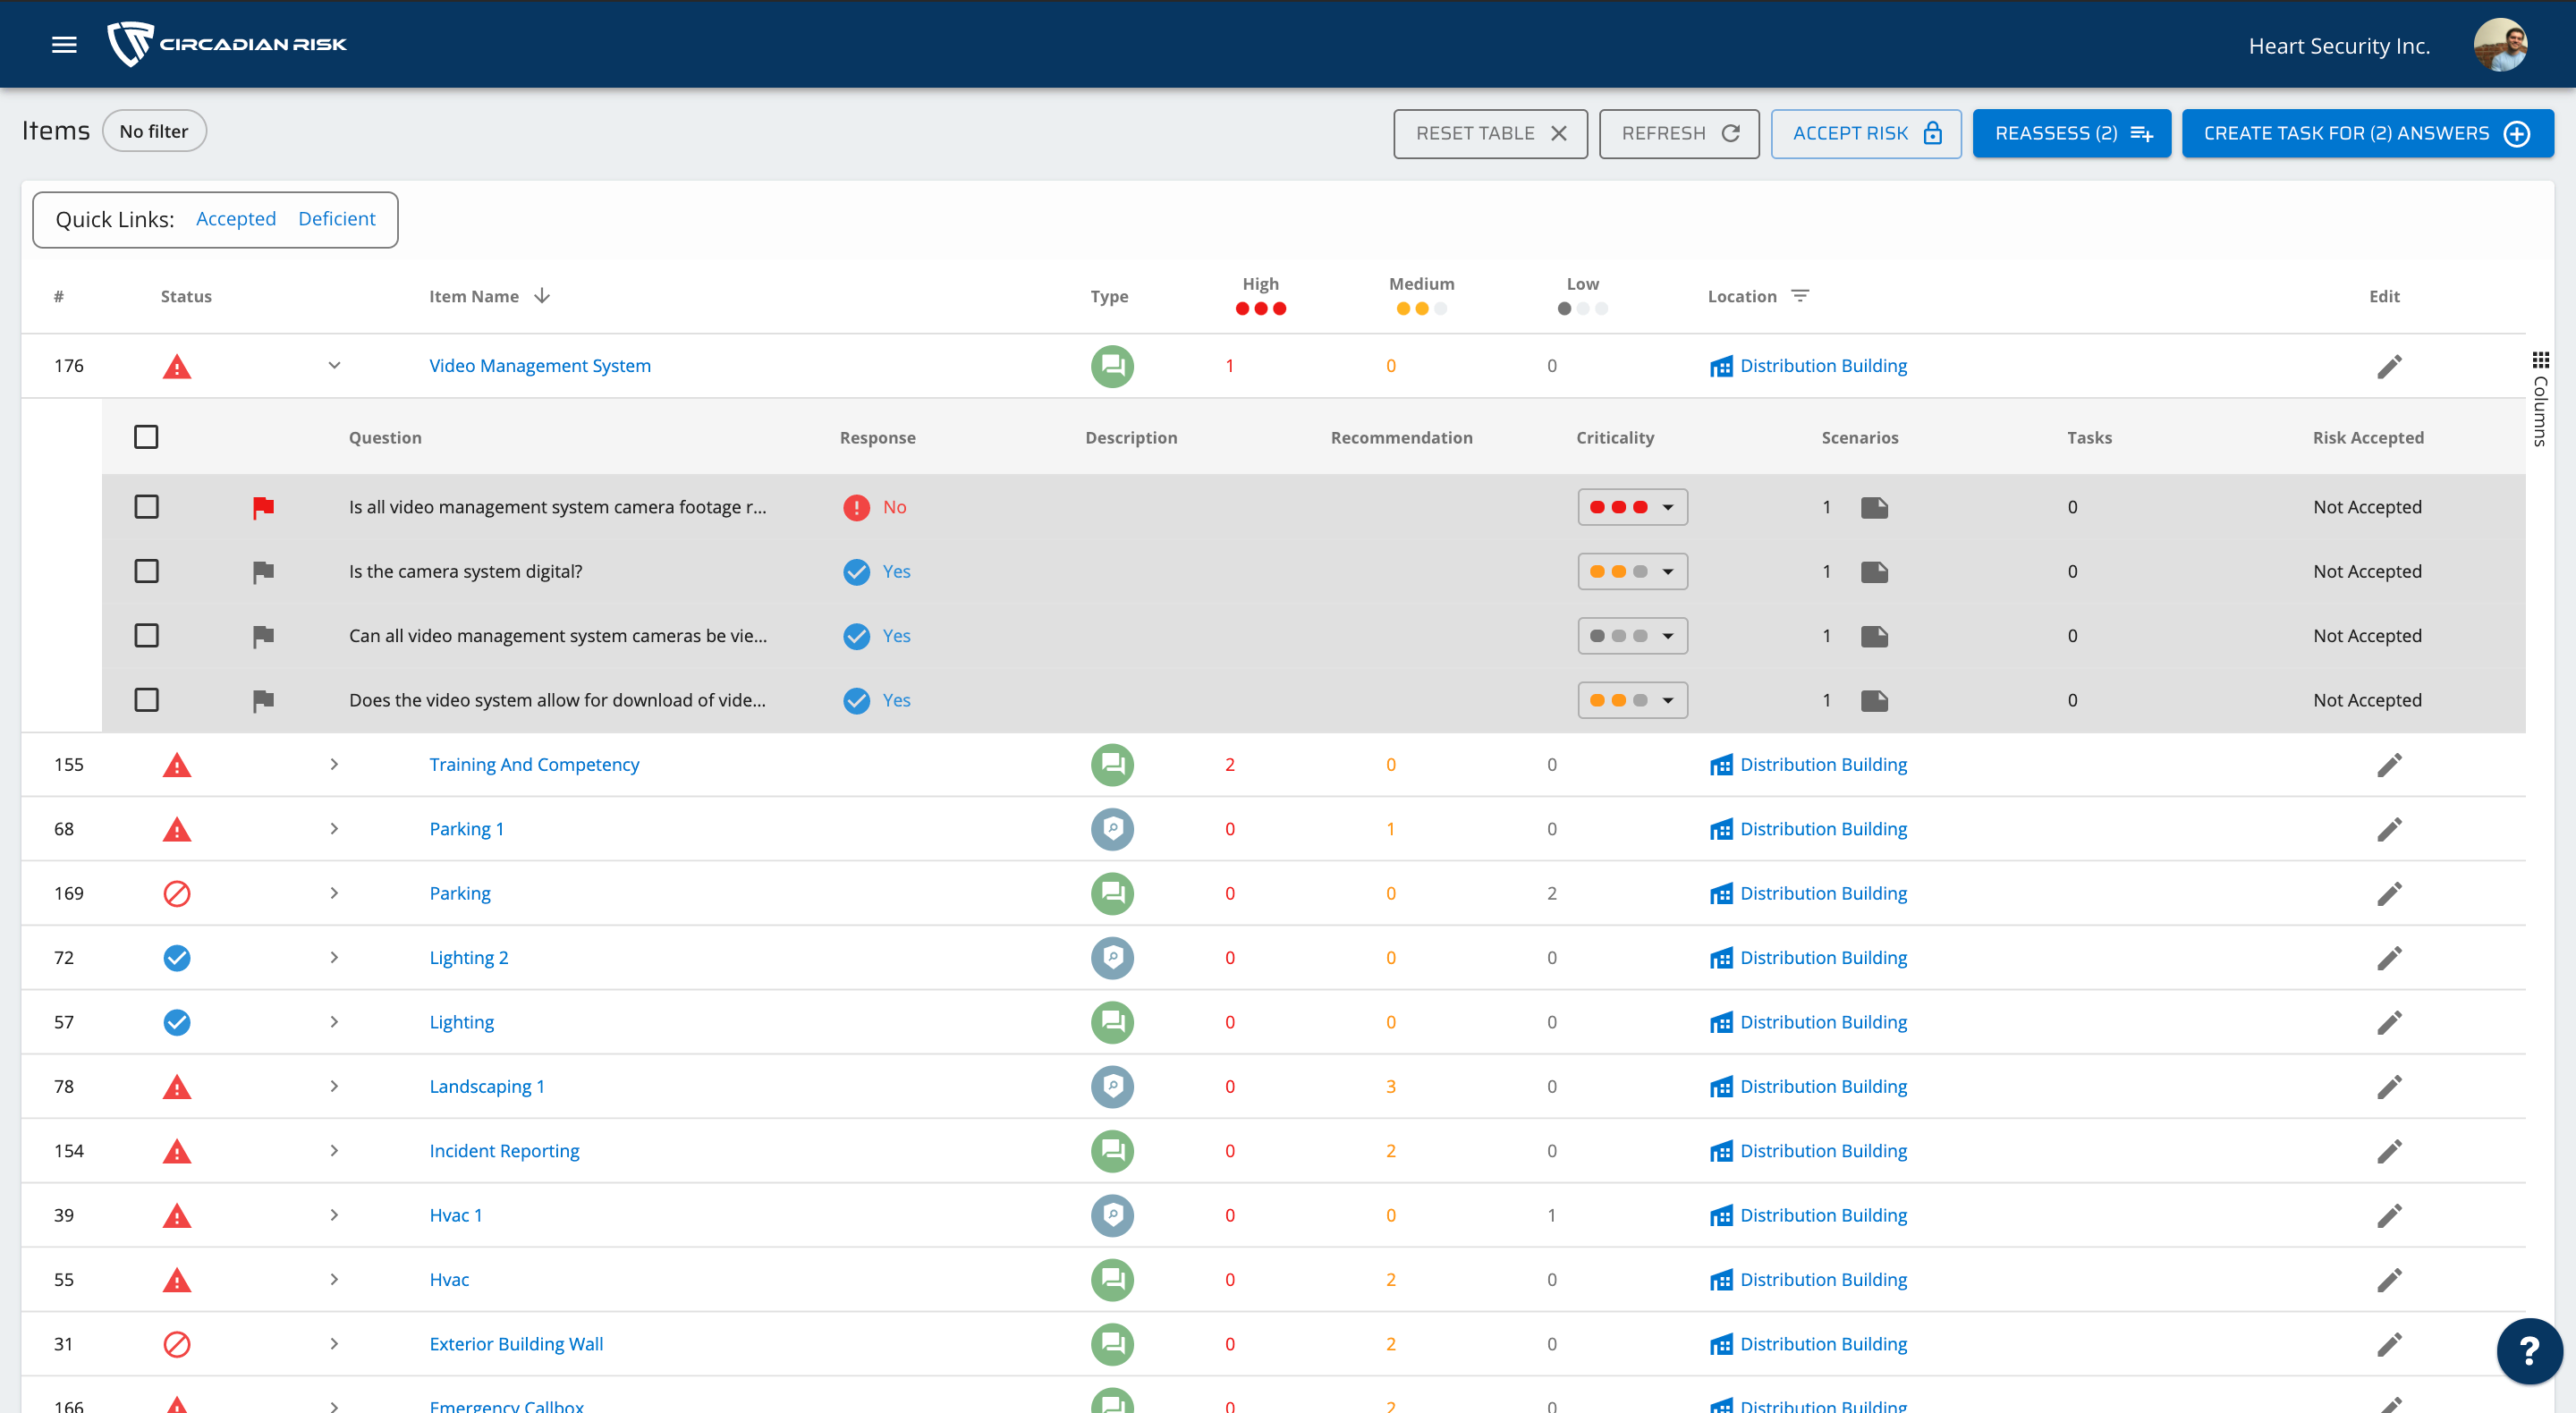
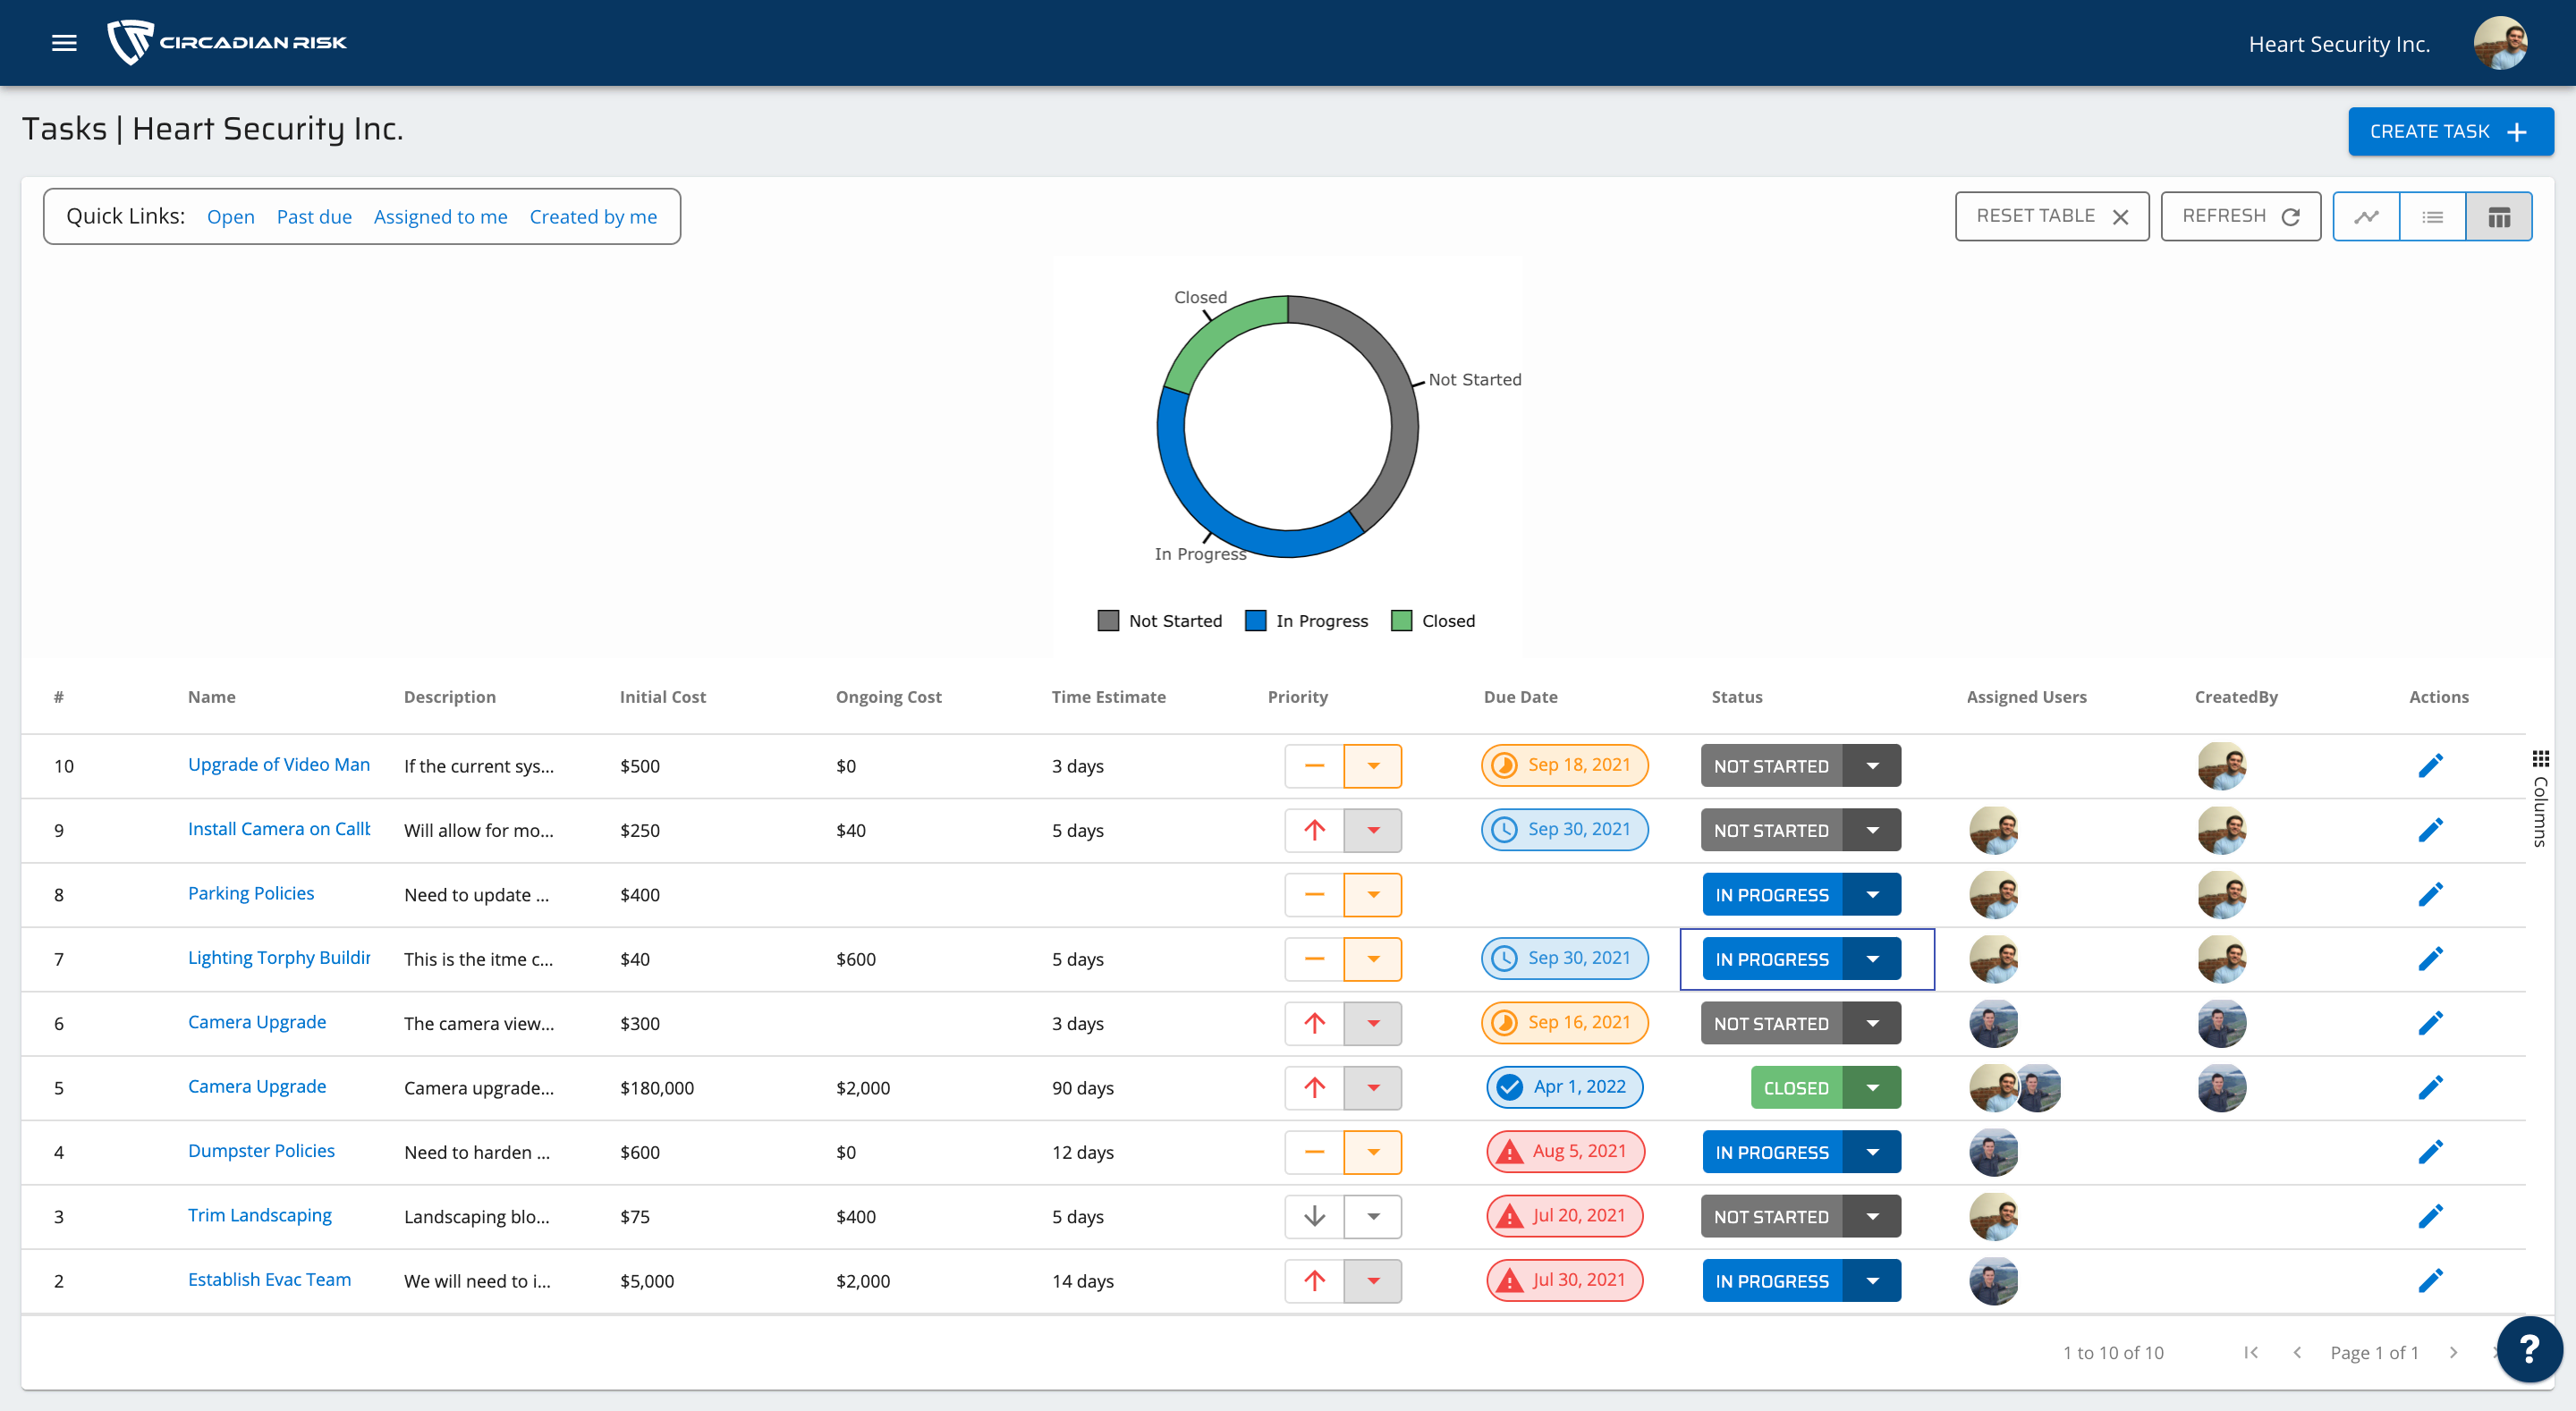 Deficiency Tasks