
Real-Time Risk Visibility for Leadership
Circadian Risk generates board-ready physical security risk reports on demand from live residual risk data, so security leaders spend their time on strategy rather than spending weeks assembling the data behind a report that will already be outdated when it lands.
Why Physical Security Risk Reporting Fails Leadership and What to Do About It
The average board-level security risk report takes days or weeks to produce. Data is pulled from multiple assessment files, translated from practitioner language into executive language, formatted into slides or documents, and reviewed before distribution. By the time leadership receives it, the underlying conditions may have already changed. And because the process is so labor-intensive, it happens quarterly at best, which means leadership is making decisions about physical risk based on a snapshot from three months ago.
The problem runs deeper than inefficiency. A narrative report that describes what was observed and recommends corrective actions does not give a board member what they actually need: a clear, quantified picture of where the organization is most exposed, how that exposure has changed since the last report, and what actions are being taken to reduce it. Circadian Risk’s Executive Dashboards and Reporting module was built to answer those three questions directly, at any time, without any manual assembly.
What Circadian Risk's Executive Dashboards Put in Front of Leadership

A Real-Time Portfolio View of Physical Risk Across Every Location
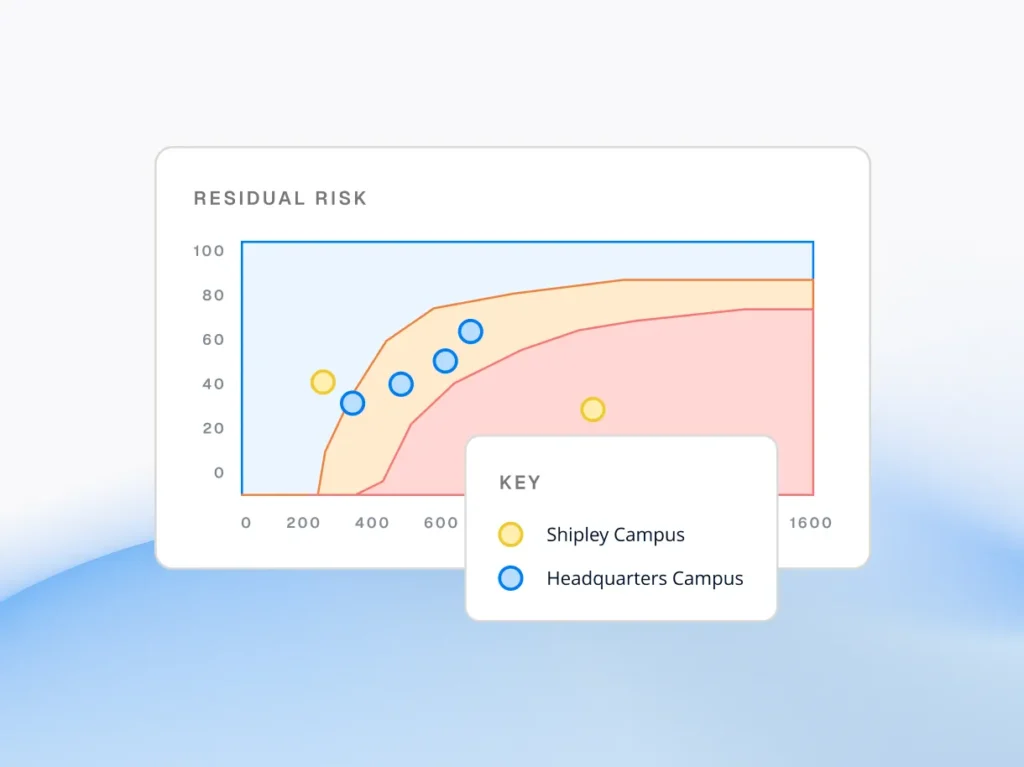
The executive dashboard displays residual risk scores for every location and every scenario in a format designed for fast comprehension at the leadership level. Risk heat maps, bubble charts, and trend lines give executives a clear visual picture of where exposure is highest, how it has changed over time, and which locations or scenarios require immediate attention.

Scenario-Level Risk Summaries That Non-Security Executives Can Read
Every scenario, active shooter, workplace violence, theft, natural hazards, compliance, and more, has its own summary view showing portfolio-wide risk levels, highest-risk locations, and remediation progress. Reports are written for the executive audience, not the security practitioner, so the people making budget and policy decisions have the context they need without requiring a security background to interpret the data.

On-Demand Report Generation Without Manual Data Assembly
Security leaders can generate a formatted, board-ready risk report at the click of a button. Reports pull from live residual risk data, reflect the current state of every assessment and every remediation task across the portfolio, and can be filtered by location, scenario, business unit, time period, or risk threshold. No manual compilation, no data translation, no formatting from scratch.
Who Uses Circadian Risk's Executive Dashboards and What They Use Them For
Chief Security Officers Reporting to the C-Suite
Use the dashboard to produce a current, quantified view of organizational physical risk exposure for the CEO, CFO, and COO, demonstrating the performance of the security program and making the case for resource allocation decisions.
Risk Officers Presenting to Audit Committees
Use scenario-specific risk summaries and trend data to show audit committees how physical risk is being monitored, what controls are in place, and how residual risk scores have changed as a result of remediation investments.
Security Leaders Preparing Quarterly Board Packages
Replace the weeks-long process of assembling quarterly board reports with on-demand generation from live data. Board packages that previously required extensive manual preparation are produced in minutes and reflect current conditions rather than last quarter’s assessment cycle.
GSOC and Operations Teams Monitoring Daily Risk
Use real-time dashboard views to monitor risk levels across the portfolio on a daily basis, identify locations where scores are trending upward, and escalate to leadership when exposure reaches a defined threshold.




What Structured Risk Remediation Delivers in Practice
Security leaders using Circadian Risk consistently report that board-level report preparation drops from days or weeks of manual effort to minutes of on-demand generation. That recovered time is reinvested into assessment completion, remediation oversight, and strategic risk program development.

By eliminating manual report writing as the primary output of the assessment process, Redstone’s security team redirected recovered time into doubling the number of locations assessed annually without adding headcount.
The Only Physical Security Risk Dashboard Built on a Quantified Methodology
Most security dashboards display activity data: incidents reported, assessments completed, tasks open or closed. Circadian Risk’s executive dashboard displays risk intelligence: the quantified residual risk score for every location and every scenario, derived from a structured inherent risk assessment and controls mapping process that produces a defensible, auditable number. This distinction matters when a board asks not just what the security team has been doing, but whether the organization is actually safer than it was a year ago. Circadian Risk answers that question with a number, not a narrative.
A Dashboard Methodology Grounded in ASIS International Standards
The risk scores that power Circadian Risk’s executive dashboards are built on assessment frameworks aligned to ASIS International standards, the most widely recognized standards in physical security management. This means every score is defensible, every report is grounded in a recognized methodology, and every board conversation about physical risk is backed by an internationally validated framework.

Frequently Asked Questions About Physical Security Executive Reporting and Risk Dashboards
What should a physical security executive dashboard show?
An effective physical security executive dashboard shows quantified residual risk scores for every location and every scenario in the organization’s portfolio, trend data showing how those scores have changed over time, and a clear view of where exposure is highest and what remediation actions are in progress or completed. Circadian Risk’s dashboard is designed specifically for the executive audience, presenting risk intelligence rather than operational activity data.
How does Circadian Risk generate board-ready reports?
Circadian Risk generates board-ready reports directly from live residual risk data. Security leaders select the scope, time period, scenarios, and locations they want to include, and the platform produces a formatted report reflecting current conditions across all selected parameters. No manual data assembly, formatting, or narrative writing is required.
How is Circadian Risk's reporting different from a standard security incident report?
Security incident reports document events that have already occurred. Circadian Risk’s executive reporting reflects the current state of physical risk exposure before incidents happen. Reports show residual risk scores, remediation progress, and trend data that give leadership a proactive view of where the organization stands and what is being done to reduce exposure.
Can reports be customized for different executive audiences?
Yes. Circadian Risk’s reporting can be filtered and configured for different audiences. A board presentation may focus on portfolio-wide risk trends and highest-risk locations. An audit committee report may focus on compliance scenario scores and remediation progress. A C-suite briefing may focus on the scenarios most relevant to the organization’s current risk environment. Each view pulls from the same live data and requires no separate data preparation.
See What Your Physical Security Risk Program Looks Like When Leadership Has the Full Picture
Walk through Circadian Risk’s Executive Dashboards and Reporting with a member of our team. See how your organization’s risk data would look when it is live, quantified, and ready for the board at any time.